Immigrants from Iran vs Immigrants from Hungary Nursery School
COMPARE
Immigrants from Iran
Immigrants from Hungary
Nursery School
Nursery School Comparison
Immigrants from Iran
Immigrants from Hungary
98.0%
NURSERY SCHOOL
68.7/ 100
METRIC RATING
154th/ 347
METRIC RANK
98.1%
NURSERY SCHOOL
89.3/ 100
METRIC RATING
135th/ 347
METRIC RANK
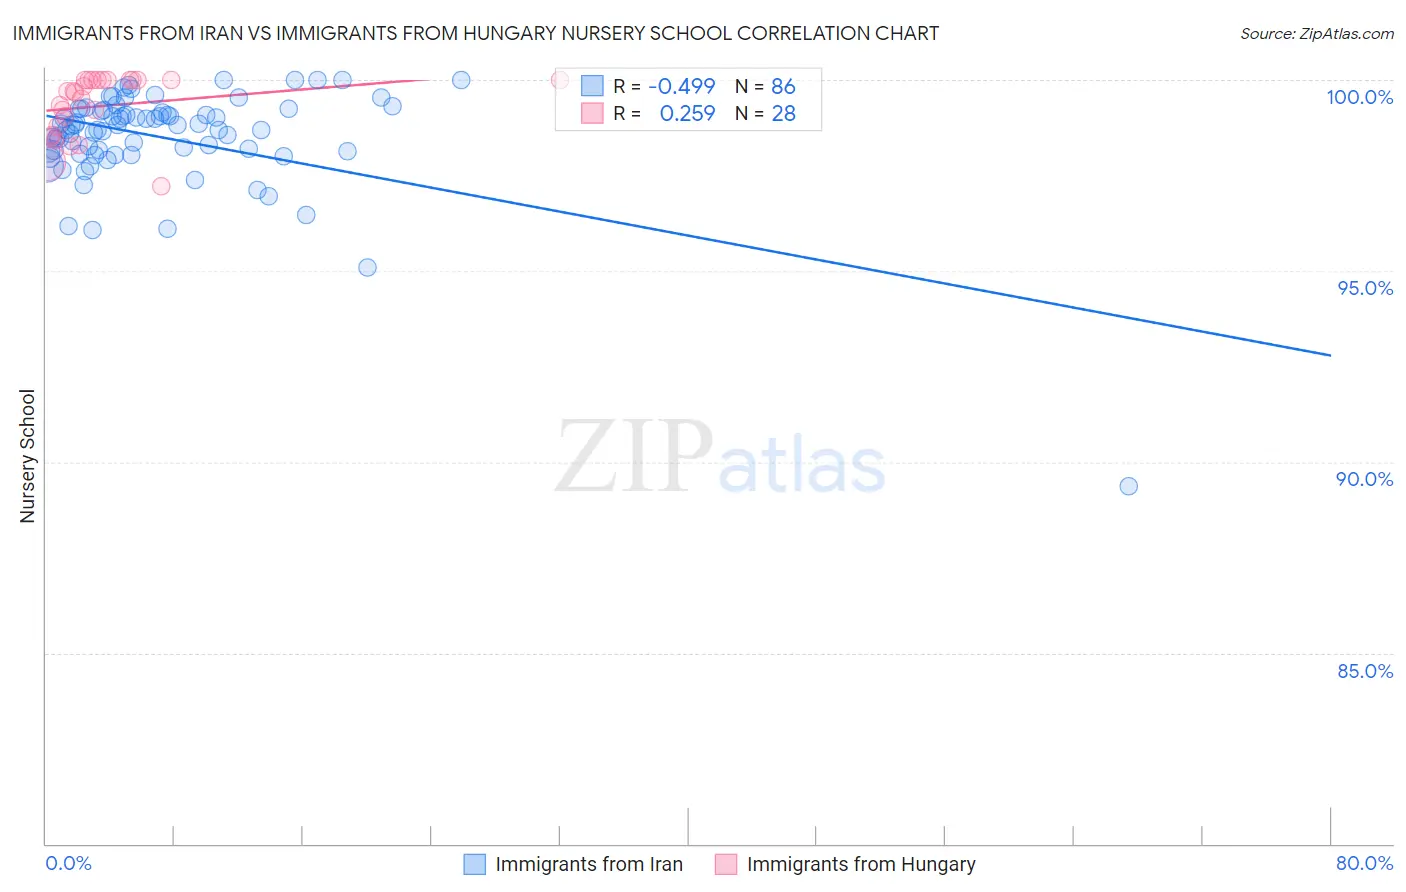
Immigrants from Iran vs Immigrants from Hungary Nursery School Correlation Chart
The statistical analysis conducted on geographies consisting of 279,886,762 people shows a moderate negative correlation between the proportion of Immigrants from Iran and percentage of population with at least nursery school education in the United States with a correlation coefficient (R) of -0.499 and weighted average of 98.0%. Similarly, the statistical analysis conducted on geographies consisting of 195,707,305 people shows a weak positive correlation between the proportion of Immigrants from Hungary and percentage of population with at least nursery school education in the United States with a correlation coefficient (R) of 0.259 and weighted average of 98.1%, a difference of 0.10%.
Nursery School Correlation Summary
| Measurement | Immigrants from Iran | Immigrants from Hungary |
| Minimum | 89.4% | 97.2% |
| Maximum | 100.0% | 100.0% |
| Range | 10.6% | 2.8% |
| Mean | 98.5% | 99.3% |
| Median | 98.8% | 99.7% |
| Interquartile 25% (IQ1) | 98.1% | 98.7% |
| Interquartile 75% (IQ3) | 99.2% | 100.0% |
| Interquartile Range (IQR) | 1.1% | 1.3% |
| Standard Deviation (Sample) | 1.4% | 0.79% |
| Standard Deviation (Population) | 1.4% | 0.78% |
Demographics Similar to Immigrants from Iran and Immigrants from Hungary by Nursery School
In terms of nursery school, the demographic groups most similar to Immigrants from Iran are Immigrants from Moldova (98.0%, a difference of 0.0%), Soviet Union (98.0%, a difference of 0.010%), Dutch West Indian (98.0%, a difference of 0.010%), Apache (98.1%, a difference of 0.020%), and Jordanian (98.1%, a difference of 0.020%). Similarly, the demographic groups most similar to Immigrants from Hungary are Immigrants from Bulgaria (98.1%, a difference of 0.0%), Immigrants from Kuwait (98.1%, a difference of 0.0%), Israeli (98.1%, a difference of 0.010%), Immigrants from Romania (98.1%, a difference of 0.010%), and Blackfeet (98.1%, a difference of 0.010%).
| Demographics | Rating | Rank | Nursery School |
| Immigrants | Bulgaria | 89.4 /100 | #134 | Excellent 98.1% |
| Immigrants | Hungary | 89.3 /100 | #135 | Excellent 98.1% |
| Immigrants | Kuwait | 88.9 /100 | #136 | Excellent 98.1% |
| Israelis | 88.2 /100 | #137 | Excellent 98.1% |
| Immigrants | Romania | 88.0 /100 | #138 | Excellent 98.1% |
| Blackfeet | 87.5 /100 | #139 | Excellent 98.1% |
| Palestinians | 83.7 /100 | #140 | Excellent 98.1% |
| Immigrants | Turkey | 83.0 /100 | #141 | Excellent 98.1% |
| Burmese | 81.7 /100 | #142 | Excellent 98.1% |
| Marshallese | 81.2 /100 | #143 | Excellent 98.1% |
| Alsatians | 80.3 /100 | #144 | Excellent 98.1% |
| Immigrants | Israel | 78.5 /100 | #145 | Good 98.1% |
| Filipinos | 78.5 /100 | #146 | Good 98.1% |
| Hmong | 75.7 /100 | #147 | Good 98.1% |
| Immigrants | Greece | 75.4 /100 | #148 | Good 98.1% |
| Apache | 73.2 /100 | #149 | Good 98.1% |
| Jordanians | 72.9 /100 | #150 | Good 98.1% |
| Soviet Union | 71.6 /100 | #151 | Good 98.0% |
| Dutch West Indians | 70.2 /100 | #152 | Good 98.0% |
| Immigrants | Moldova | 69.6 /100 | #153 | Good 98.0% |
| Immigrants | Iran | 68.7 /100 | #154 | Good 98.0% |