Alsatian vs Ecuadorian Bachelor's Degree
COMPARE
Alsatian
Ecuadorian
Bachelor's Degree
Bachelor's Degree Comparison
Alsatians
Ecuadorians
41.0%
BACHELOR'S DEGREE
97.0/ 100
METRIC RATING
106th/ 347
METRIC RANK
35.4%
BACHELOR'S DEGREE
6.6/ 100
METRIC RATING
227th/ 347
METRIC RANK
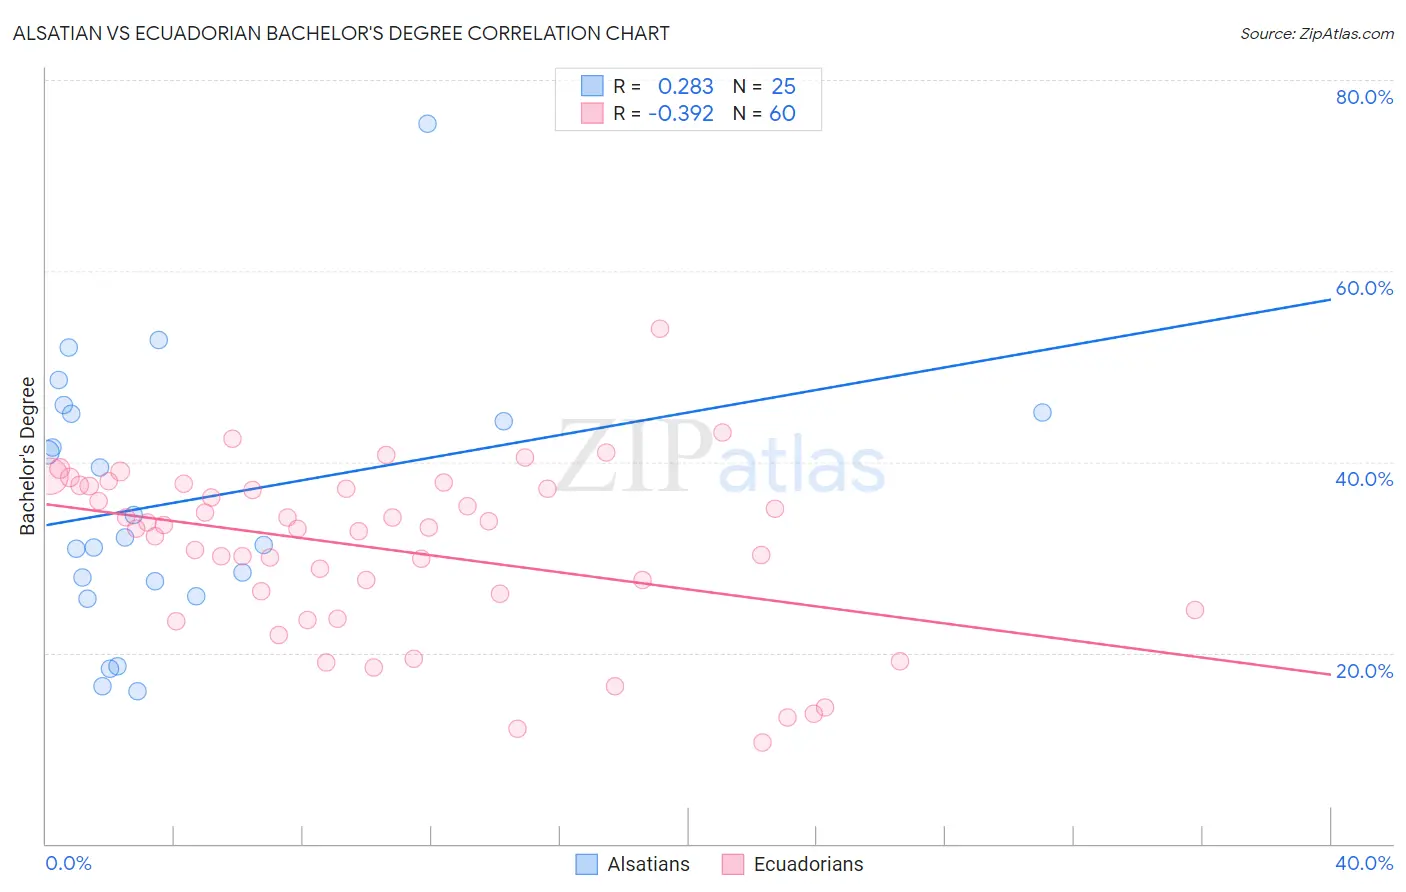
Alsatian vs Ecuadorian Bachelor's Degree Correlation Chart
The statistical analysis conducted on geographies consisting of 82,682,365 people shows a weak positive correlation between the proportion of Alsatians and percentage of population with at least bachelor's degree education in the United States with a correlation coefficient (R) of 0.283 and weighted average of 41.0%. Similarly, the statistical analysis conducted on geographies consisting of 317,830,457 people shows a mild negative correlation between the proportion of Ecuadorians and percentage of population with at least bachelor's degree education in the United States with a correlation coefficient (R) of -0.392 and weighted average of 35.4%, a difference of 16.0%.
Bachelor's Degree Correlation Summary
| Measurement | Alsatian | Ecuadorian |
| Minimum | 16.0% | 10.6% |
| Maximum | 75.4% | 53.9% |
| Range | 59.4% | 43.3% |
| Mean | 35.8% | 30.9% |
| Median | 32.1% | 33.1% |
| Interquartile 25% (IQ1) | 26.7% | 25.3% |
| Interquartile 75% (IQ3) | 45.1% | 37.4% |
| Interquartile Range (IQR) | 18.4% | 12.1% |
| Standard Deviation (Sample) | 13.8% | 8.9% |
| Standard Deviation (Population) | 13.5% | 8.8% |
Similar Demographics by Bachelor's Degree
Demographics Similar to Alsatians by Bachelor's Degree
In terms of bachelor's degree, the demographic groups most similar to Alsatians are Northern European (41.0%, a difference of 0.17%), Syrian (41.1%, a difference of 0.26%), Jordanian (41.2%, a difference of 0.29%), Ukrainian (40.9%, a difference of 0.31%), and Arab (40.9%, a difference of 0.33%).
| Demographics | Rating | Rank | Bachelor's Degree |
| Immigrants | England | 98.1 /100 | #99 | Exceptional 41.4% |
| Macedonians | 98.1 /100 | #100 | Exceptional 41.4% |
| Immigrants | Morocco | 98.0 /100 | #101 | Exceptional 41.4% |
| Immigrants | Italy | 97.8 /100 | #102 | Exceptional 41.3% |
| Chileans | 97.5 /100 | #103 | Exceptional 41.2% |
| Jordanians | 97.4 /100 | #104 | Exceptional 41.2% |
| Syrians | 97.4 /100 | #105 | Exceptional 41.1% |
| Alsatians | 97.0 /100 | #106 | Exceptional 41.0% |
| Northern Europeans | 96.8 /100 | #107 | Exceptional 41.0% |
| Ukrainians | 96.6 /100 | #108 | Exceptional 40.9% |
| Arabs | 96.6 /100 | #109 | Exceptional 40.9% |
| Albanians | 96.5 /100 | #110 | Exceptional 40.9% |
| Immigrants | Chile | 96.4 /100 | #111 | Exceptional 40.8% |
| Ugandans | 96.3 /100 | #112 | Exceptional 40.8% |
| Brazilians | 96.3 /100 | #113 | Exceptional 40.8% |
Demographics Similar to Ecuadorians by Bachelor's Degree
In terms of bachelor's degree, the demographic groups most similar to Ecuadorians are Immigrants from Trinidad and Tobago (35.3%, a difference of 0.23%), Portuguese (35.5%, a difference of 0.26%), Immigrants from Burma/Myanmar (35.5%, a difference of 0.30%), White/Caucasian (35.3%, a difference of 0.31%), and Immigrants from Barbados (35.5%, a difference of 0.37%).
| Demographics | Rating | Rank | Bachelor's Degree |
| Spanish | 9.6 /100 | #220 | Tragic 35.8% |
| Dutch | 9.2 /100 | #221 | Tragic 35.7% |
| Trinidadians and Tobagonians | 8.8 /100 | #222 | Tragic 35.7% |
| French Canadians | 8.3 /100 | #223 | Tragic 35.6% |
| Immigrants | Barbados | 7.5 /100 | #224 | Tragic 35.5% |
| Immigrants | Burma/Myanmar | 7.3 /100 | #225 | Tragic 35.5% |
| Portuguese | 7.2 /100 | #226 | Tragic 35.5% |
| Ecuadorians | 6.6 /100 | #227 | Tragic 35.4% |
| Immigrants | Trinidad and Tobago | 6.0 /100 | #228 | Tragic 35.3% |
| Whites/Caucasians | 5.9 /100 | #229 | Tragic 35.3% |
| Immigrants | Grenada | 4.3 /100 | #230 | Tragic 35.0% |
| Immigrants | St. Vincent and the Grenadines | 4.3 /100 | #231 | Tragic 35.0% |
| Hmong | 3.4 /100 | #232 | Tragic 34.8% |
| Immigrants | Ecuador | 3.3 /100 | #233 | Tragic 34.7% |
| Guamanians/Chamorros | 3.0 /100 | #234 | Tragic 34.6% |