Immigrants from Zaire vs Cherokee Bachelor's Degree
COMPARE
Immigrants from Zaire
Cherokee
Bachelor's Degree
Bachelor's Degree Comparison
Immigrants from Zaire
Cherokee
36.8%
BACHELOR'S DEGREE
25.3/ 100
METRIC RATING
202nd/ 347
METRIC RANK
30.2%
BACHELOR'S DEGREE
0.0/ 100
METRIC RATING
304th/ 347
METRIC RANK
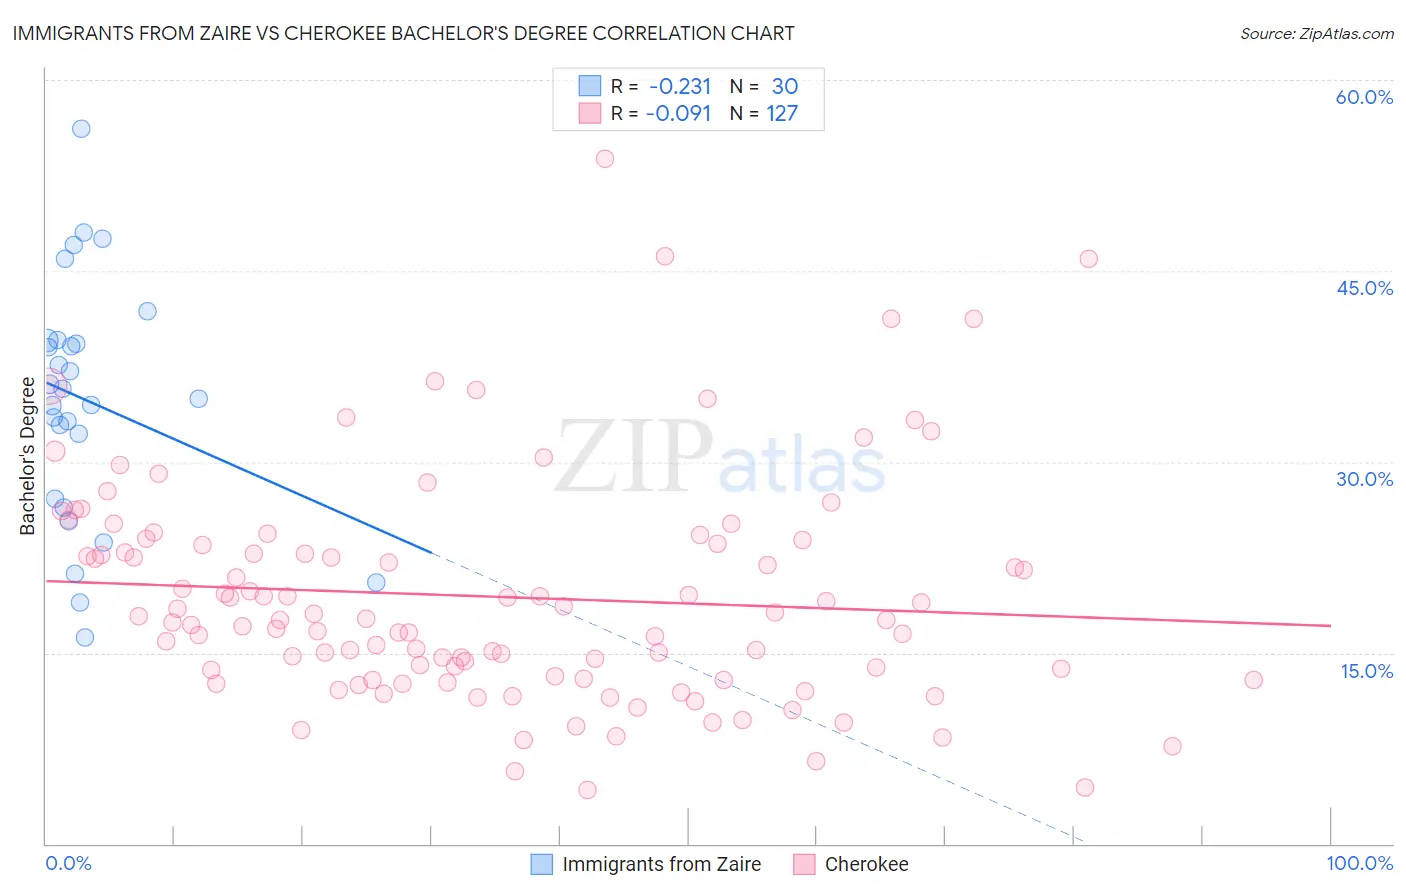
Immigrants from Zaire vs Cherokee Bachelor's Degree Correlation Chart
The statistical analysis conducted on geographies consisting of 107,252,315 people shows a weak negative correlation between the proportion of Immigrants from Zaire and percentage of population with at least bachelor's degree education in the United States with a correlation coefficient (R) of -0.231 and weighted average of 36.8%. Similarly, the statistical analysis conducted on geographies consisting of 493,657,197 people shows a slight negative correlation between the proportion of Cherokee and percentage of population with at least bachelor's degree education in the United States with a correlation coefficient (R) of -0.091 and weighted average of 30.2%, a difference of 22.0%.
Bachelor's Degree Correlation Summary
| Measurement | Immigrants from Zaire | Cherokee |
| Minimum | 16.2% | 4.3% |
| Maximum | 56.2% | 53.8% |
| Range | 40.0% | 49.6% |
| Mean | 34.8% | 19.4% |
| Median | 35.4% | 17.6% |
| Interquartile 25% (IQ1) | 27.1% | 13.0% |
| Interquartile 75% (IQ3) | 39.5% | 23.6% |
| Interquartile Range (IQR) | 12.4% | 10.6% |
| Standard Deviation (Sample) | 9.4% | 8.9% |
| Standard Deviation (Population) | 9.3% | 8.8% |
Similar Demographics by Bachelor's Degree
Demographics Similar to Immigrants from Zaire by Bachelor's Degree
In terms of bachelor's degree, the demographic groups most similar to Immigrants from Zaire are Immigrants from South Eastern Asia (36.8%, a difference of 0.010%), Immigrants from Ghana (36.9%, a difference of 0.27%), Immigrants from Costa Rica (36.9%, a difference of 0.28%), Immigrants from Nigeria (36.7%, a difference of 0.29%), and Immigrants (36.7%, a difference of 0.33%).
| Demographics | Rating | Rank | Bachelor's Degree |
| Koreans | 29.8 /100 | #195 | Fair 37.0% |
| Celtics | 29.5 /100 | #196 | Fair 37.0% |
| Czechoslovakians | 29.2 /100 | #197 | Fair 37.0% |
| Welsh | 29.1 /100 | #198 | Fair 37.0% |
| Immigrants | Costa Rica | 27.4 /100 | #199 | Fair 36.9% |
| Immigrants | Ghana | 27.4 /100 | #200 | Fair 36.9% |
| Immigrants | South Eastern Asia | 25.4 /100 | #201 | Fair 36.8% |
| Immigrants | Zaire | 25.3 /100 | #202 | Fair 36.8% |
| Immigrants | Nigeria | 23.1 /100 | #203 | Fair 36.7% |
| Immigrants | Immigrants | 22.8 /100 | #204 | Fair 36.7% |
| Finns | 22.2 /100 | #205 | Fair 36.7% |
| Spaniards | 21.2 /100 | #206 | Fair 36.6% |
| Immigrants | Middle Africa | 20.6 /100 | #207 | Fair 36.6% |
| Immigrants | Thailand | 19.4 /100 | #208 | Poor 36.5% |
| Panamanians | 18.8 /100 | #209 | Poor 36.5% |
Demographics Similar to Cherokee by Bachelor's Degree
In terms of bachelor's degree, the demographic groups most similar to Cherokee are Bangladeshi (30.2%, a difference of 0.010%), Mexican American Indian (30.2%, a difference of 0.17%), Immigrants from Latin America (30.1%, a difference of 0.42%), Immigrants from Cuba (30.3%, a difference of 0.45%), and Immigrants from Micronesia (30.4%, a difference of 0.67%).
| Demographics | Rating | Rank | Bachelor's Degree |
| Immigrants | Haiti | 0.0 /100 | #297 | Tragic 30.6% |
| Chippewa | 0.0 /100 | #298 | Tragic 30.6% |
| Chickasaw | 0.0 /100 | #299 | Tragic 30.4% |
| Immigrants | Micronesia | 0.0 /100 | #300 | Tragic 30.4% |
| Immigrants | Cuba | 0.0 /100 | #301 | Tragic 30.3% |
| Mexican American Indians | 0.0 /100 | #302 | Tragic 30.2% |
| Bangladeshis | 0.0 /100 | #303 | Tragic 30.2% |
| Cherokee | 0.0 /100 | #304 | Tragic 30.2% |
| Immigrants | Latin America | 0.0 /100 | #305 | Tragic 30.1% |
| Immigrants | Yemen | 0.0 /100 | #306 | Tragic 29.9% |
| Nepalese | 0.0 /100 | #307 | Tragic 29.9% |
| Cajuns | 0.0 /100 | #308 | Tragic 29.6% |
| Hispanics or Latinos | 0.0 /100 | #309 | Tragic 29.6% |
| Cheyenne | 0.0 /100 | #310 | Tragic 29.4% |
| Choctaw | 0.0 /100 | #311 | Tragic 29.4% |