Immigrants from Indonesia vs Greek 11th Grade
COMPARE
Immigrants from Indonesia
Greek
11th Grade
11th Grade Comparison
Immigrants from Indonesia
Greeks
92.4%
11TH GRADE
33.7/ 100
METRIC RATING
188th/ 347
METRIC RANK
94.1%
11TH GRADE
99.9/ 100
METRIC RATING
43rd/ 347
METRIC RANK
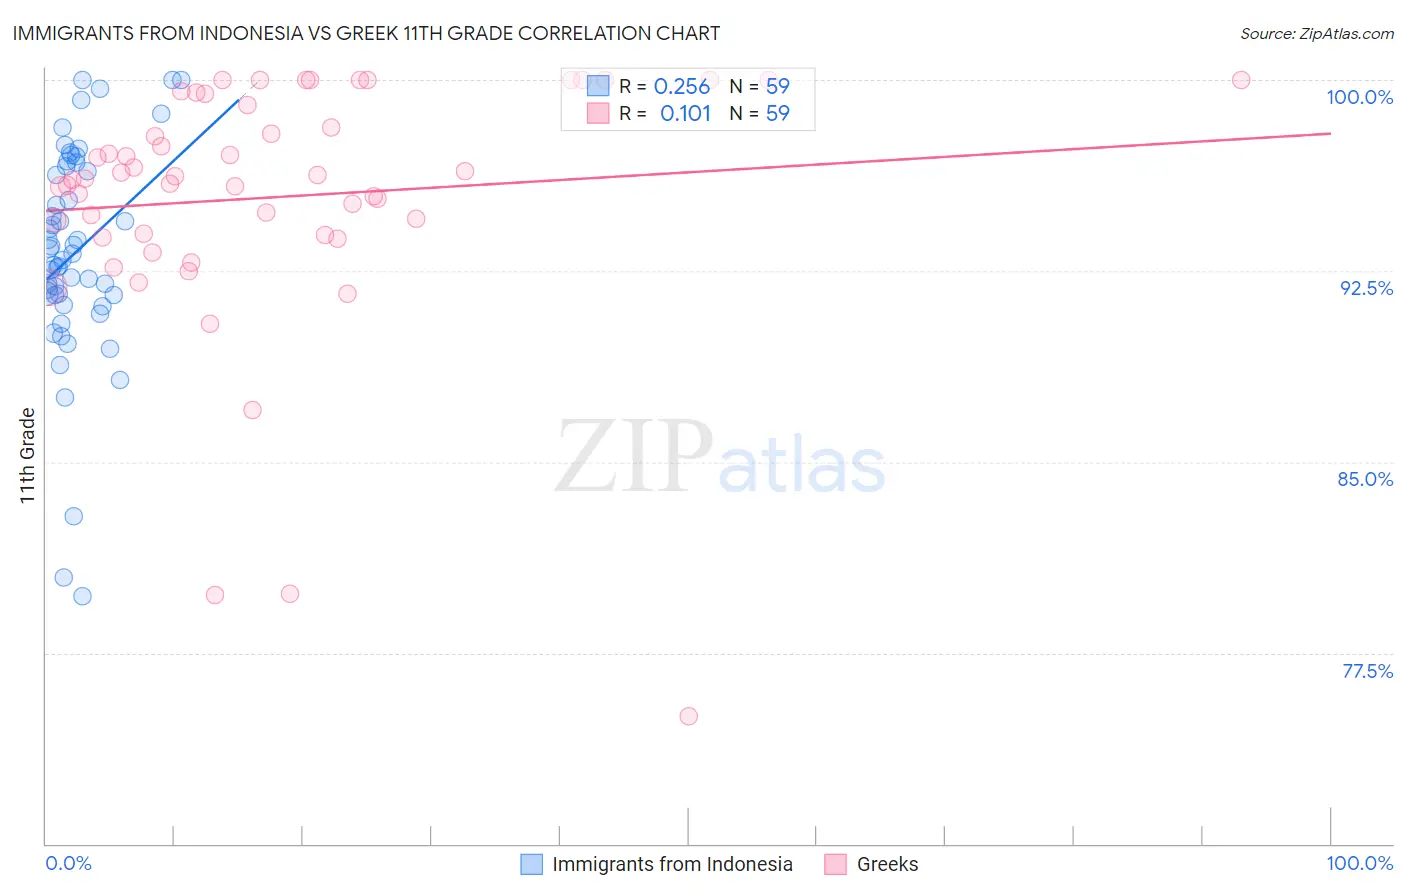
Immigrants from Indonesia vs Greek 11th Grade Correlation Chart
The statistical analysis conducted on geographies consisting of 215,778,424 people shows a weak positive correlation between the proportion of Immigrants from Indonesia and percentage of population with at least 11th grade education in the United States with a correlation coefficient (R) of 0.256 and weighted average of 92.4%. Similarly, the statistical analysis conducted on geographies consisting of 482,775,362 people shows a poor positive correlation between the proportion of Greeks and percentage of population with at least 11th grade education in the United States with a correlation coefficient (R) of 0.101 and weighted average of 94.1%, a difference of 1.9%.
11th Grade Correlation Summary
| Measurement | Immigrants from Indonesia | Greek |
| Minimum | 79.7% | 75.0% |
| Maximum | 100.0% | 100.0% |
| Range | 20.3% | 25.0% |
| Mean | 93.2% | 95.4% |
| Median | 93.2% | 96.1% |
| Interquartile 25% (IQ1) | 91.5% | 93.9% |
| Interquartile 75% (IQ3) | 96.6% | 99.5% |
| Interquartile Range (IQR) | 5.1% | 5.5% |
| Standard Deviation (Sample) | 4.2% | 5.0% |
| Standard Deviation (Population) | 4.2% | 4.9% |
Similar Demographics by 11th Grade
Demographics Similar to Immigrants from Indonesia by 11th Grade
In terms of 11th grade, the demographic groups most similar to Immigrants from Indonesia are Immigrants from Chile (92.4%, a difference of 0.0%), Immigrants from Western Asia (92.4%, a difference of 0.010%), Arapaho (92.4%, a difference of 0.020%), Immigrants from Nepal (92.4%, a difference of 0.030%), and Chickasaw (92.3%, a difference of 0.030%).
| Demographics | Rating | Rank | 11th Grade |
| Cherokee | 40.7 /100 | #181 | Average 92.4% |
| Immigrants | Morocco | 38.6 /100 | #182 | Fair 92.4% |
| Immigrants | Malaysia | 37.6 /100 | #183 | Fair 92.4% |
| Immigrants | Asia | 37.4 /100 | #184 | Fair 92.4% |
| Immigrants | Nepal | 36.4 /100 | #185 | Fair 92.4% |
| Arapaho | 35.1 /100 | #186 | Fair 92.4% |
| Immigrants | Western Asia | 35.0 /100 | #187 | Fair 92.4% |
| Immigrants | Indonesia | 33.7 /100 | #188 | Fair 92.4% |
| Immigrants | Chile | 33.3 /100 | #189 | Fair 92.4% |
| Chickasaw | 31.4 /100 | #190 | Fair 92.3% |
| French American Indians | 30.8 /100 | #191 | Fair 92.3% |
| Immigrants | Syria | 30.4 /100 | #192 | Fair 92.3% |
| Moroccans | 28.7 /100 | #193 | Fair 92.3% |
| Sioux | 28.5 /100 | #194 | Fair 92.3% |
| Liberians | 26.8 /100 | #195 | Fair 92.3% |
Demographics Similar to Greeks by 11th Grade
In terms of 11th grade, the demographic groups most similar to Greeks are Cypriot (94.1%, a difference of 0.010%), Immigrants from Austria (94.1%, a difference of 0.010%), Immigrants from Ireland (94.1%, a difference of 0.010%), Immigrants from Lithuania (94.1%, a difference of 0.020%), and Thai (94.1%, a difference of 0.020%).
| Demographics | Rating | Rank | 11th Grade |
| Immigrants | Northern Europe | 99.9 /100 | #36 | Exceptional 94.2% |
| Northern Europeans | 99.9 /100 | #37 | Exceptional 94.2% |
| Hungarians | 99.9 /100 | #38 | Exceptional 94.2% |
| Immigrants | Lithuania | 99.9 /100 | #39 | Exceptional 94.1% |
| Thais | 99.9 /100 | #40 | Exceptional 94.1% |
| Cypriots | 99.9 /100 | #41 | Exceptional 94.1% |
| Immigrants | Austria | 99.9 /100 | #42 | Exceptional 94.1% |
| Greeks | 99.9 /100 | #43 | Exceptional 94.1% |
| Immigrants | Ireland | 99.9 /100 | #44 | Exceptional 94.1% |
| Australians | 99.9 /100 | #45 | Exceptional 94.1% |
| Serbians | 99.9 /100 | #46 | Exceptional 94.1% |
| Filipinos | 99.9 /100 | #47 | Exceptional 94.1% |
| Macedonians | 99.9 /100 | #48 | Exceptional 94.1% |
| Slavs | 99.9 /100 | #49 | Exceptional 94.1% |
| French | 99.9 /100 | #50 | Exceptional 94.1% |