Immigrants from Indonesia vs South American Professional Degree
COMPARE
Immigrants from Indonesia
South American
Professional Degree
Professional Degree Comparison
Immigrants from Indonesia
South Americans
5.3%
PROFESSIONAL DEGREE
99.7/ 100
METRIC RATING
75th/ 347
METRIC RANK
4.7%
PROFESSIONAL DEGREE
85.6/ 100
METRIC RATING
139th/ 347
METRIC RANK
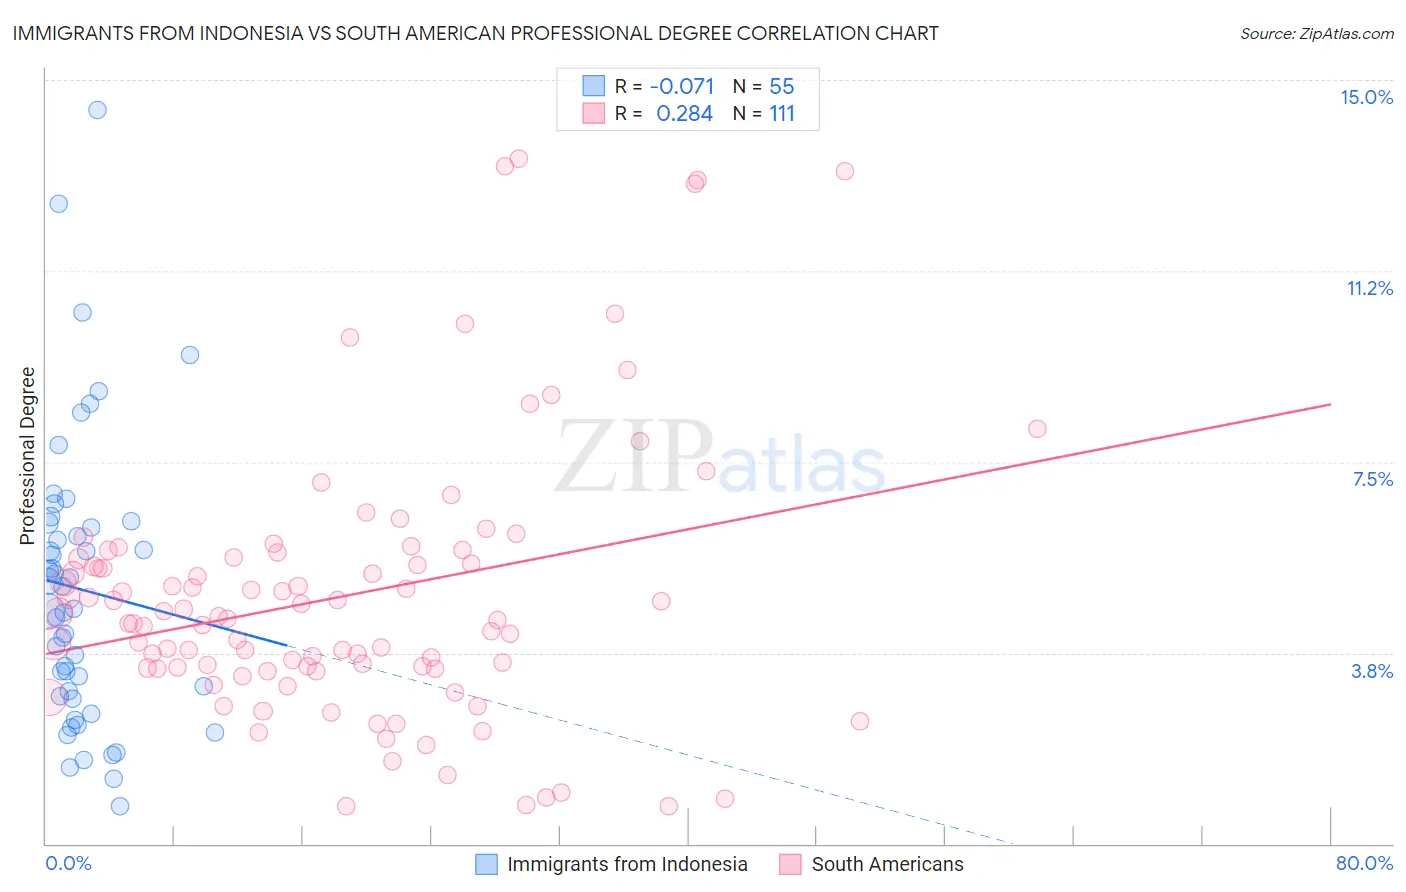
Immigrants from Indonesia vs South American Professional Degree Correlation Chart
The statistical analysis conducted on geographies consisting of 215,647,199 people shows a slight negative correlation between the proportion of Immigrants from Indonesia and percentage of population with at least professional degree education in the United States with a correlation coefficient (R) of -0.071 and weighted average of 5.3%. Similarly, the statistical analysis conducted on geographies consisting of 492,254,354 people shows a weak positive correlation between the proportion of South Americans and percentage of population with at least professional degree education in the United States with a correlation coefficient (R) of 0.284 and weighted average of 4.7%, a difference of 14.0%.
Professional Degree Correlation Summary
| Measurement | Immigrants from Indonesia | South American |
| Minimum | 0.73% | 0.74% |
| Maximum | 14.4% | 13.5% |
| Range | 13.7% | 12.7% |
| Mean | 5.0% | 4.9% |
| Median | 4.6% | 4.4% |
| Interquartile 25% (IQ1) | 2.9% | 3.4% |
| Interquartile 75% (IQ3) | 6.3% | 5.6% |
| Interquartile Range (IQR) | 3.4% | 2.2% |
| Standard Deviation (Sample) | 2.8% | 2.7% |
| Standard Deviation (Population) | 2.8% | 2.7% |
Similar Demographics by Professional Degree
Demographics Similar to Immigrants from Indonesia by Professional Degree
In terms of professional degree, the demographic groups most similar to Immigrants from Indonesia are Immigrants from Canada (5.3%, a difference of 0.090%), Ethiopian (5.4%, a difference of 0.13%), Immigrants from Ethiopia (5.3%, a difference of 0.13%), Armenian (5.3%, a difference of 0.17%), and Immigrants from North America (5.3%, a difference of 0.35%).
| Demographics | Rating | Rank | Professional Degree |
| Immigrants | Lebanon | 99.9 /100 | #68 | Exceptional 5.5% |
| Immigrants | Hungary | 99.9 /100 | #69 | Exceptional 5.5% |
| Bhutanese | 99.8 /100 | #70 | Exceptional 5.4% |
| Immigrants | Western Asia | 99.8 /100 | #71 | Exceptional 5.4% |
| Lithuanians | 99.8 /100 | #72 | Exceptional 5.4% |
| Immigrants | Romania | 99.8 /100 | #73 | Exceptional 5.4% |
| Ethiopians | 99.7 /100 | #74 | Exceptional 5.4% |
| Immigrants | Indonesia | 99.7 /100 | #75 | Exceptional 5.3% |
| Immigrants | Canada | 99.7 /100 | #76 | Exceptional 5.3% |
| Immigrants | Ethiopia | 99.7 /100 | #77 | Exceptional 5.3% |
| Armenians | 99.7 /100 | #78 | Exceptional 5.3% |
| Immigrants | North America | 99.7 /100 | #79 | Exceptional 5.3% |
| Immigrants | England | 99.6 /100 | #80 | Exceptional 5.3% |
| Immigrants | Brazil | 99.6 /100 | #81 | Exceptional 5.3% |
| Romanians | 99.6 /100 | #82 | Exceptional 5.3% |
Demographics Similar to South Americans by Professional Degree
In terms of professional degree, the demographic groups most similar to South Americans are Canadian (4.7%, a difference of 0.34%), Basque (4.6%, a difference of 0.96%), Afghan (4.7%, a difference of 0.99%), Jordanian (4.7%, a difference of 1.0%), and Immigrants from Jordan (4.7%, a difference of 1.1%).
| Demographics | Rating | Rank | Professional Degree |
| Pakistanis | 90.9 /100 | #132 | Exceptional 4.8% |
| Italians | 90.2 /100 | #133 | Exceptional 4.8% |
| South American Indians | 89.9 /100 | #134 | Excellent 4.8% |
| Macedonians | 89.8 /100 | #135 | Excellent 4.8% |
| Immigrants | Jordan | 89.0 /100 | #136 | Excellent 4.7% |
| Jordanians | 88.9 /100 | #137 | Excellent 4.7% |
| Afghans | 88.8 /100 | #138 | Excellent 4.7% |
| South Americans | 85.6 /100 | #139 | Excellent 4.7% |
| Canadians | 84.4 /100 | #140 | Excellent 4.7% |
| Basques | 81.8 /100 | #141 | Excellent 4.6% |
| Sudanese | 81.3 /100 | #142 | Excellent 4.6% |
| Hungarians | 80.8 /100 | #143 | Excellent 4.6% |
| Immigrants | South America | 80.5 /100 | #144 | Excellent 4.6% |
| Uruguayans | 80.2 /100 | #145 | Excellent 4.6% |
| Luxembourgers | 78.7 /100 | #146 | Good 4.6% |