Immigrants from Indonesia vs Afghan 1st Grade
COMPARE
Immigrants from Indonesia
Afghan
1st Grade
1st Grade Comparison
Immigrants from Indonesia
Afghans
97.6%
1ST GRADE
1.2/ 100
METRIC RATING
242nd/ 347
METRIC RANK
97.4%
1ST GRADE
0.1/ 100
METRIC RATING
280th/ 347
METRIC RANK
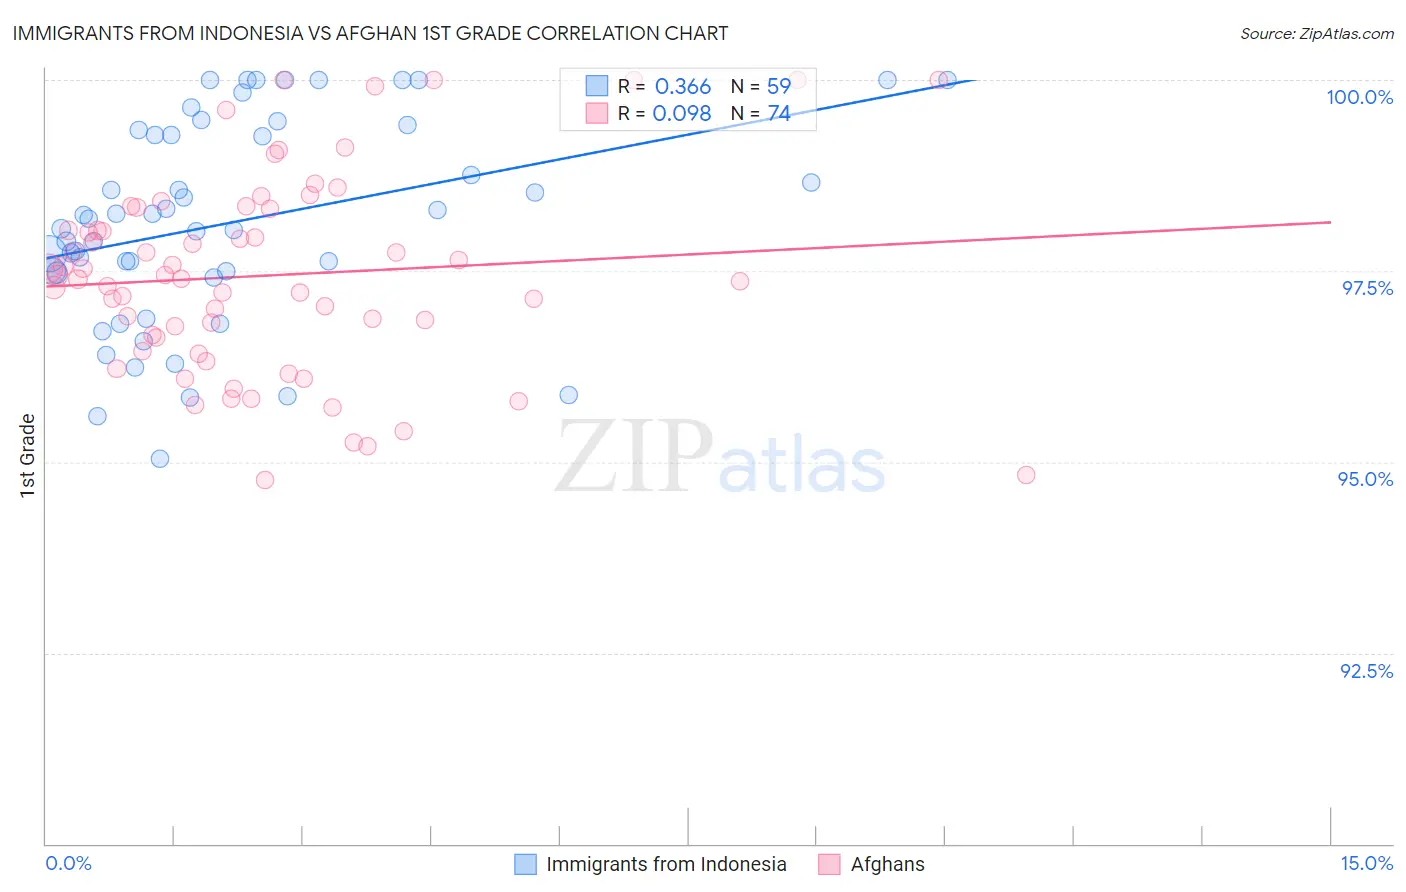
Immigrants from Indonesia vs Afghan 1st Grade Correlation Chart
The statistical analysis conducted on geographies consisting of 215,782,971 people shows a mild positive correlation between the proportion of Immigrants from Indonesia and percentage of population with at least 1st grade education in the United States with a correlation coefficient (R) of 0.366 and weighted average of 97.6%. Similarly, the statistical analysis conducted on geographies consisting of 148,851,685 people shows a slight positive correlation between the proportion of Afghans and percentage of population with at least 1st grade education in the United States with a correlation coefficient (R) of 0.098 and weighted average of 97.4%, a difference of 0.25%.
1st Grade Correlation Summary
| Measurement | Immigrants from Indonesia | Afghan |
| Minimum | 95.0% | 94.8% |
| Maximum | 100.0% | 100.0% |
| Range | 5.0% | 5.2% |
| Mean | 98.1% | 97.4% |
| Median | 98.2% | 97.4% |
| Interquartile 25% (IQ1) | 97.5% | 96.6% |
| Interquartile 75% (IQ3) | 99.3% | 98.3% |
| Interquartile Range (IQR) | 1.9% | 1.7% |
| Standard Deviation (Sample) | 1.3% | 1.3% |
| Standard Deviation (Population) | 1.3% | 1.3% |
Similar Demographics by 1st Grade
Demographics Similar to Immigrants from Indonesia by 1st Grade
In terms of 1st grade, the demographic groups most similar to Immigrants from Indonesia are Bolivian (97.6%, a difference of 0.0%), Liberian (97.6%, a difference of 0.010%), Asian (97.6%, a difference of 0.010%), South American (97.6%, a difference of 0.010%), and Immigrants from Eastern Africa (97.6%, a difference of 0.010%).
| Demographics | Rating | Rank | 1st Grade |
| Immigrants | Malaysia | 2.1 /100 | #235 | Tragic 97.6% |
| Immigrants | Western Asia | 2.1 /100 | #236 | Tragic 97.6% |
| U.S. Virgin Islanders | 1.9 /100 | #237 | Tragic 97.6% |
| Nigerians | 1.8 /100 | #238 | Tragic 97.6% |
| Immigrants | Eastern Asia | 1.6 /100 | #239 | Tragic 97.6% |
| Koreans | 1.5 /100 | #240 | Tragic 97.6% |
| Liberians | 1.4 /100 | #241 | Tragic 97.6% |
| Immigrants | Indonesia | 1.2 /100 | #242 | Tragic 97.6% |
| Bolivians | 1.2 /100 | #243 | Tragic 97.6% |
| Asians | 1.1 /100 | #244 | Tragic 97.6% |
| South Americans | 1.1 /100 | #245 | Tragic 97.6% |
| Immigrants | Eastern Africa | 1.0 /100 | #246 | Tragic 97.6% |
| Peruvians | 1.0 /100 | #247 | Tragic 97.6% |
| Immigrants | Middle Africa | 1.0 /100 | #248 | Tragic 97.6% |
| Immigrants | Senegal | 1.0 /100 | #249 | Tragic 97.6% |
Demographics Similar to Afghans by 1st Grade
In terms of 1st grade, the demographic groups most similar to Afghans are Trinidadian and Tobagonian (97.3%, a difference of 0.0%), Barbadian (97.3%, a difference of 0.0%), Immigrants from Uzbekistan (97.4%, a difference of 0.010%), Immigrants from Ghana (97.4%, a difference of 0.010%), and Immigrants from Western Africa (97.4%, a difference of 0.030%).
| Demographics | Rating | Rank | 1st Grade |
| Immigrants | Bolivia | 0.2 /100 | #273 | Tragic 97.4% |
| Ghanaians | 0.1 /100 | #274 | Tragic 97.4% |
| Immigrants | China | 0.1 /100 | #275 | Tragic 97.4% |
| Immigrants | Philippines | 0.1 /100 | #276 | Tragic 97.4% |
| Immigrants | Western Africa | 0.1 /100 | #277 | Tragic 97.4% |
| Immigrants | Uzbekistan | 0.1 /100 | #278 | Tragic 97.4% |
| Immigrants | Ghana | 0.1 /100 | #279 | Tragic 97.4% |
| Afghans | 0.1 /100 | #280 | Tragic 97.4% |
| Trinidadians and Tobagonians | 0.1 /100 | #281 | Tragic 97.3% |
| Barbadians | 0.1 /100 | #282 | Tragic 97.3% |
| Immigrants | West Indies | 0.0 /100 | #283 | Tragic 97.3% |
| Immigrants | Trinidad and Tobago | 0.0 /100 | #284 | Tragic 97.3% |
| Immigrants | Portugal | 0.0 /100 | #285 | Tragic 97.3% |
| Immigrants | Barbados | 0.0 /100 | #286 | Tragic 97.3% |
| Immigrants | Hong Kong | 0.0 /100 | #287 | Tragic 97.3% |