Puerto Rican vs Inupiat 10th Grade
COMPARE
Puerto Rican
Inupiat
10th Grade
10th Grade Comparison
Puerto Ricans
Inupiat
89.8%
10TH GRADE
0.0/ 100
METRIC RATING
325th/ 347
METRIC RANK
94.4%
10TH GRADE
95.1/ 100
METRIC RATING
122nd/ 347
METRIC RANK
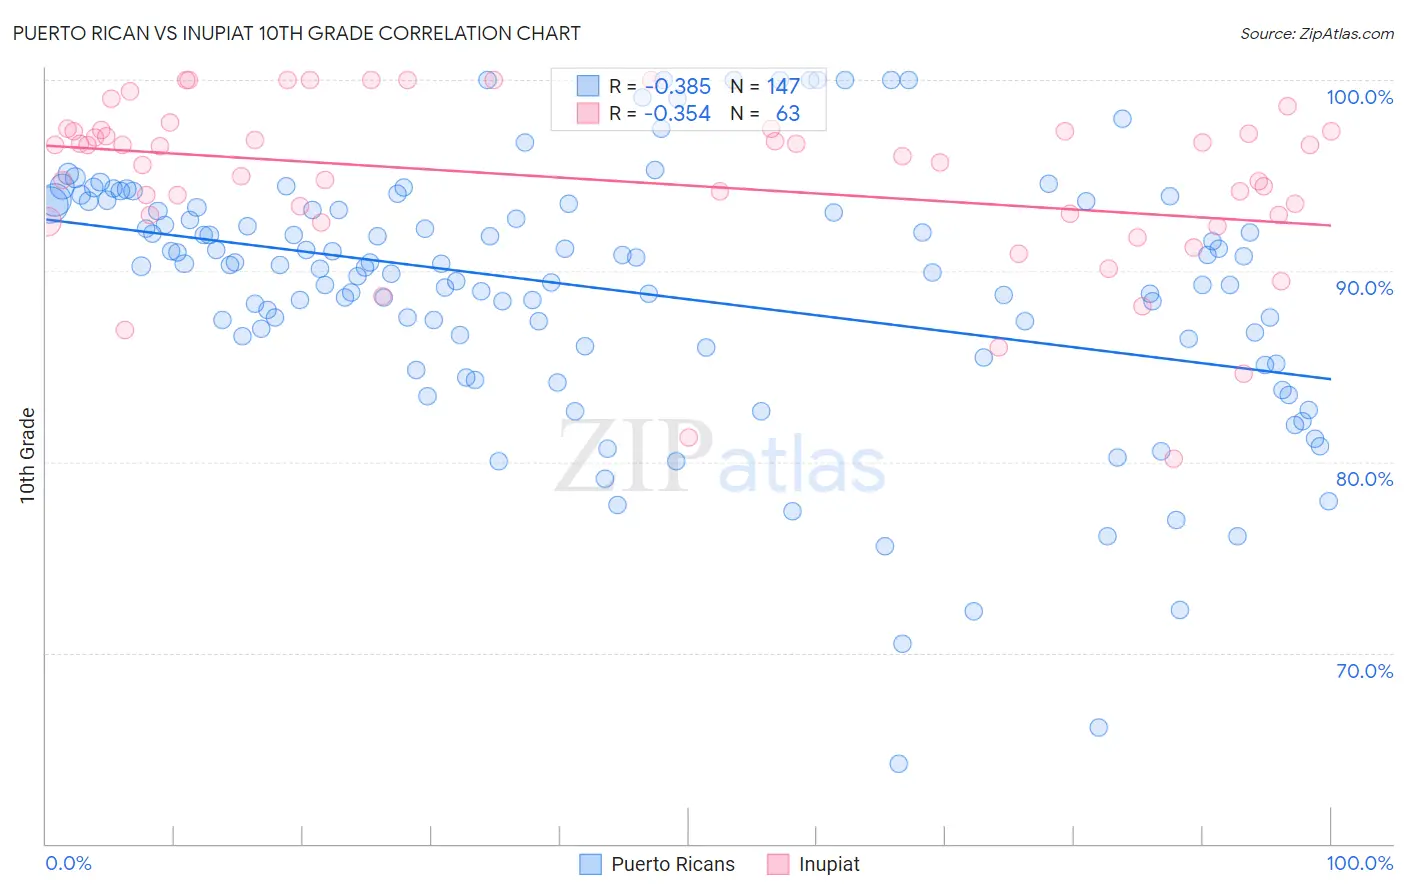
Puerto Rican vs Inupiat 10th Grade Correlation Chart
The statistical analysis conducted on geographies consisting of 528,320,613 people shows a mild negative correlation between the proportion of Puerto Ricans and percentage of population with at least 10th grade education in the United States with a correlation coefficient (R) of -0.385 and weighted average of 89.8%. Similarly, the statistical analysis conducted on geographies consisting of 96,349,240 people shows a mild negative correlation between the proportion of Inupiat and percentage of population with at least 10th grade education in the United States with a correlation coefficient (R) of -0.354 and weighted average of 94.4%, a difference of 5.0%.
10th Grade Correlation Summary
| Measurement | Puerto Rican | Inupiat |
| Minimum | 64.2% | 80.2% |
| Maximum | 100.0% | 100.0% |
| Range | 35.8% | 19.8% |
| Mean | 89.0% | 94.7% |
| Median | 90.2% | 96.0% |
| Interquartile 25% (IQ1) | 86.1% | 92.9% |
| Interquartile 75% (IQ3) | 93.3% | 97.3% |
| Interquartile Range (IQR) | 7.3% | 4.4% |
| Standard Deviation (Sample) | 6.7% | 4.4% |
| Standard Deviation (Population) | 6.7% | 4.4% |
Similar Demographics by 10th Grade
Demographics Similar to Puerto Ricans by 10th Grade
In terms of 10th grade, the demographic groups most similar to Puerto Ricans are Immigrants from Armenia (89.9%, a difference of 0.020%), Central American Indian (89.7%, a difference of 0.18%), Immigrants from Belize (90.1%, a difference of 0.24%), Tohono O'odham (90.1%, a difference of 0.33%), and Belizean (90.2%, a difference of 0.34%).
| Demographics | Rating | Rank | 10th Grade |
| Immigrants | Cuba | 0.0 /100 | #318 | Tragic 90.2% |
| Nicaraguans | 0.0 /100 | #319 | Tragic 90.2% |
| Houma | 0.0 /100 | #320 | Tragic 90.2% |
| Belizeans | 0.0 /100 | #321 | Tragic 90.2% |
| Tohono O'odham | 0.0 /100 | #322 | Tragic 90.1% |
| Immigrants | Belize | 0.0 /100 | #323 | Tragic 90.1% |
| Immigrants | Armenia | 0.0 /100 | #324 | Tragic 89.9% |
| Puerto Ricans | 0.0 /100 | #325 | Tragic 89.8% |
| Central American Indians | 0.0 /100 | #326 | Tragic 89.7% |
| Immigrants | Nicaragua | 0.0 /100 | #327 | Tragic 89.5% |
| Immigrants | Cabo Verde | 0.0 /100 | #328 | Tragic 89.5% |
| Dominicans | 0.0 /100 | #329 | Tragic 89.4% |
| Immigrants | Yemen | 0.0 /100 | #330 | Tragic 89.1% |
| Mexican American Indians | 0.0 /100 | #331 | Tragic 89.0% |
| Immigrants | Azores | 0.0 /100 | #332 | Tragic 89.0% |
Demographics Similar to Inupiat by 10th Grade
In terms of 10th grade, the demographic groups most similar to Inupiat are Immigrants from Belarus (94.4%, a difference of 0.0%), Cree (94.4%, a difference of 0.0%), Immigrants from Israel (94.4%, a difference of 0.010%), Immigrants from Taiwan (94.4%, a difference of 0.010%), and Basque (94.3%, a difference of 0.010%).
| Demographics | Rating | Rank | 10th Grade |
| Delaware | 96.3 /100 | #115 | Exceptional 94.4% |
| Sioux | 96.2 /100 | #116 | Exceptional 94.4% |
| Immigrants | Hungary | 95.8 /100 | #117 | Exceptional 94.4% |
| Jordanians | 95.6 /100 | #118 | Exceptional 94.4% |
| Immigrants | Israel | 95.4 /100 | #119 | Exceptional 94.4% |
| Immigrants | Taiwan | 95.3 /100 | #120 | Exceptional 94.4% |
| Immigrants | Belarus | 95.2 /100 | #121 | Exceptional 94.4% |
| Inupiat | 95.1 /100 | #122 | Exceptional 94.4% |
| Cree | 95.1 /100 | #123 | Exceptional 94.4% |
| Basques | 94.9 /100 | #124 | Exceptional 94.3% |
| Americans | 94.4 /100 | #125 | Exceptional 94.3% |
| Immigrants | Iran | 94.4 /100 | #126 | Exceptional 94.3% |
| Israelis | 93.8 /100 | #127 | Exceptional 94.3% |
| Potawatomi | 93.6 /100 | #128 | Exceptional 94.3% |
| Iroquois | 92.8 /100 | #129 | Exceptional 94.3% |