Immigrants from India vs Immigrants from West Indies Median Household Income
COMPARE
Immigrants from India
Immigrants from West Indies
Median Household Income
Median Household Income Comparison
Immigrants from India
Immigrants from West Indies
$113,009
MEDIAN HOUSEHOLD INCOME
100.0/ 100
METRIC RATING
3rd/ 347
METRIC RANK
$77,956
MEDIAN HOUSEHOLD INCOME
1.0/ 100
METRIC RATING
252nd/ 347
METRIC RANK
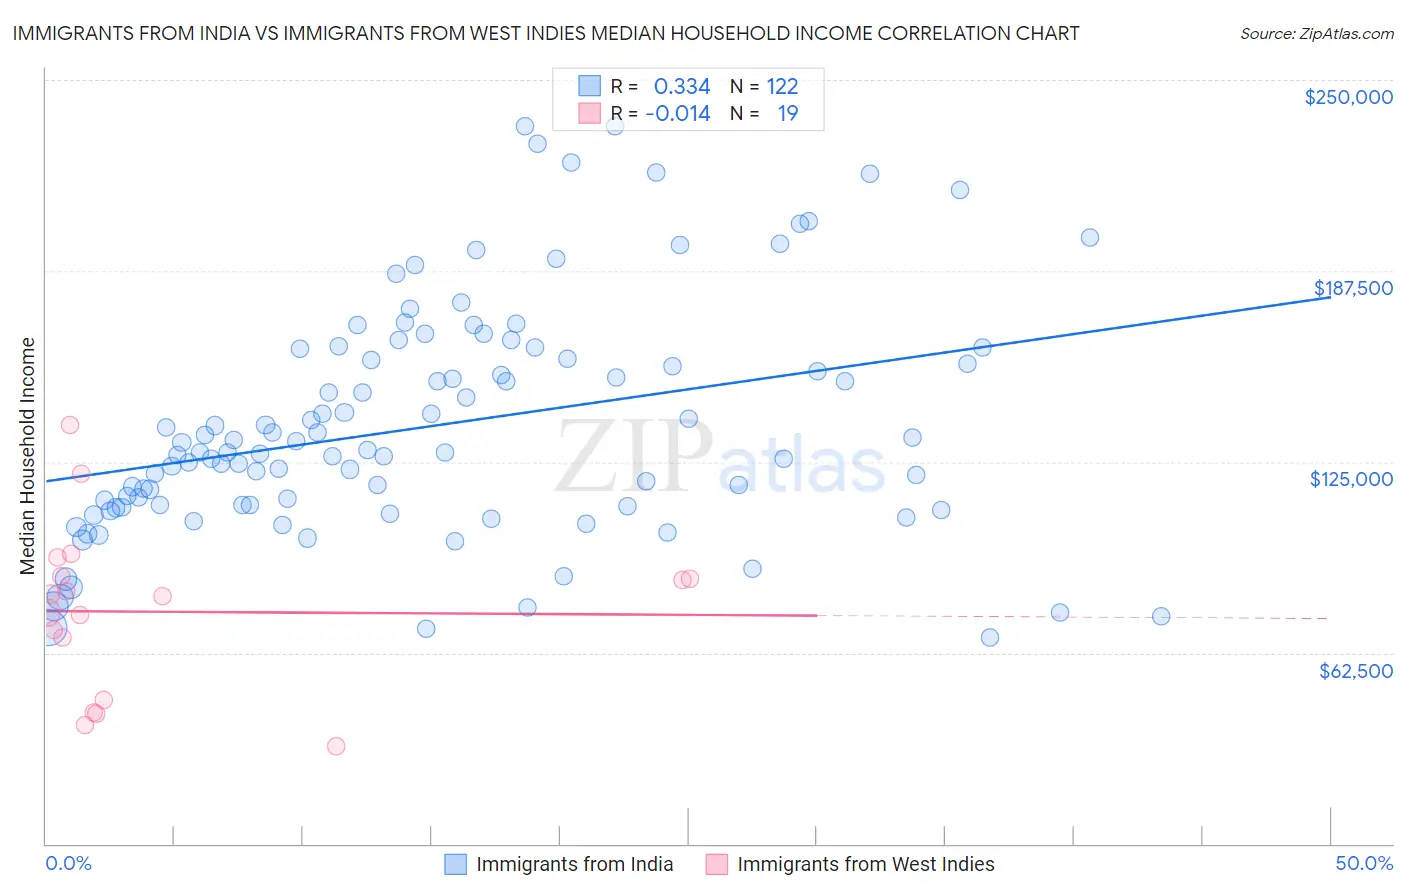
Immigrants from India vs Immigrants from West Indies Median Household Income Correlation Chart
The statistical analysis conducted on geographies consisting of 433,644,009 people shows a mild positive correlation between the proportion of Immigrants from India and median household income in the United States with a correlation coefficient (R) of 0.334 and weighted average of $113,009. Similarly, the statistical analysis conducted on geographies consisting of 72,454,628 people shows no correlation between the proportion of Immigrants from West Indies and median household income in the United States with a correlation coefficient (R) of -0.014 and weighted average of $77,956, a difference of 45.0%.
Median Household Income Correlation Summary
| Measurement | Immigrants from India | Immigrants from West Indies |
| Minimum | $67,645 | $31,731 |
| Maximum | $235,000 | $137,182 |
| Range | $167,355 | $105,451 |
| Mean | $136,655 | $75,944 |
| Median | $128,100 | $81,103 |
| Interquartile 25% (IQ1) | $110,458 | $46,875 |
| Interquartile 75% (IQ3) | $158,899 | $87,404 |
| Interquartile Range (IQR) | $48,441 | $40,529 |
| Standard Deviation (Sample) | $37,841 | $27,297 |
| Standard Deviation (Population) | $37,686 | $26,569 |
Similar Demographics by Median Household Income
Demographics Similar to Immigrants from India by Median Household Income
In terms of median household income, the demographic groups most similar to Immigrants from India are Immigrants from Hong Kong ($111,519, a difference of 1.3%), Thai ($110,648, a difference of 2.1%), Filipino ($115,509, a difference of 2.2%), Immigrants from Singapore ($110,428, a difference of 2.3%), and Iranian ($109,835, a difference of 2.9%).
| Demographics | Rating | Rank | Median Household Income |
| Immigrants | Taiwan | 100.0 /100 | #1 | Exceptional $116,460 |
| Filipinos | 100.0 /100 | #2 | Exceptional $115,509 |
| Immigrants | India | 100.0 /100 | #3 | Exceptional $113,009 |
| Immigrants | Hong Kong | 100.0 /100 | #4 | Exceptional $111,519 |
| Thais | 100.0 /100 | #5 | Exceptional $110,648 |
| Immigrants | Singapore | 100.0 /100 | #6 | Exceptional $110,428 |
| Iranians | 100.0 /100 | #7 | Exceptional $109,835 |
| Immigrants | Iran | 100.0 /100 | #8 | Exceptional $108,055 |
| Okinawans | 100.0 /100 | #9 | Exceptional $106,624 |
| Immigrants | South Central Asia | 100.0 /100 | #10 | Exceptional $106,057 |
| Immigrants | China | 100.0 /100 | #11 | Exceptional $105,335 |
| Indians (Asian) | 100.0 /100 | #12 | Exceptional $105,262 |
| Immigrants | Eastern Asia | 100.0 /100 | #13 | Exceptional $104,796 |
| Immigrants | Ireland | 100.0 /100 | #14 | Exceptional $104,692 |
| Immigrants | Israel | 100.0 /100 | #15 | Exceptional $104,090 |
Demographics Similar to Immigrants from West Indies by Median Household Income
In terms of median household income, the demographic groups most similar to Immigrants from West Indies are Mexican American Indian ($78,166, a difference of 0.27%), Immigrants from St. Vincent and the Grenadines ($77,690, a difference of 0.34%), Subsaharan African ($77,631, a difference of 0.42%), Immigrants from Laos ($78,327, a difference of 0.48%), and Immigrants from Middle Africa ($77,559, a difference of 0.51%).
| Demographics | Rating | Rank | Median Household Income |
| Inupiat | 1.8 /100 | #245 | Tragic $78,841 |
| Central Americans | 1.7 /100 | #246 | Tragic $78,803 |
| Immigrants | Burma/Myanmar | 1.6 /100 | #247 | Tragic $78,682 |
| Sudanese | 1.5 /100 | #248 | Tragic $78,529 |
| West Indians | 1.4 /100 | #249 | Tragic $78,455 |
| Immigrants | Laos | 1.3 /100 | #250 | Tragic $78,327 |
| Mexican American Indians | 1.2 /100 | #251 | Tragic $78,166 |
| Immigrants | West Indies | 1.0 /100 | #252 | Tragic $77,956 |
| Immigrants | St. Vincent and the Grenadines | 0.9 /100 | #253 | Tragic $77,690 |
| Sub-Saharan Africans | 0.8 /100 | #254 | Tragic $77,631 |
| Immigrants | Middle Africa | 0.8 /100 | #255 | Tragic $77,559 |
| Belizeans | 0.6 /100 | #256 | Tragic $77,028 |
| Immigrants | Senegal | 0.5 /100 | #257 | Tragic $76,915 |
| Immigrants | Nicaragua | 0.5 /100 | #258 | Tragic $76,784 |
| Spanish American Indians | 0.4 /100 | #259 | Tragic $76,670 |