Immigrants from Bangladesh vs Pueblo 2nd Grade
COMPARE
Immigrants from Bangladesh
Pueblo
2nd Grade
2nd Grade Comparison
Immigrants from Bangladesh
Pueblo
96.7%
2ND GRADE
0.0/ 100
METRIC RATING
322nd/ 347
METRIC RANK
98.3%
2ND GRADE
99.8/ 100
METRIC RATING
53rd/ 347
METRIC RANK
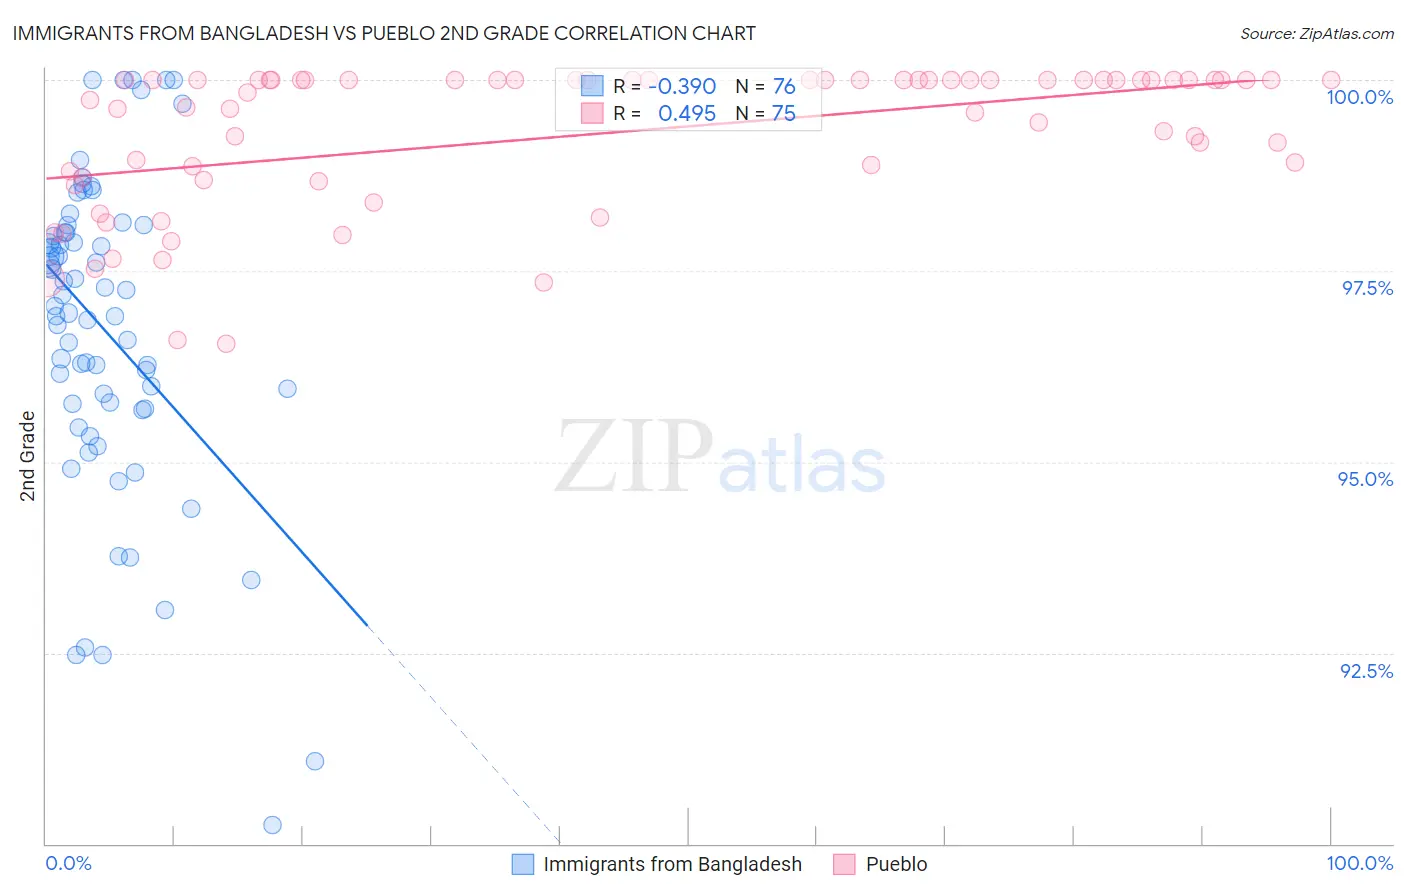
Immigrants from Bangladesh vs Pueblo 2nd Grade Correlation Chart
The statistical analysis conducted on geographies consisting of 203,681,254 people shows a mild negative correlation between the proportion of Immigrants from Bangladesh and percentage of population with at least 2nd grade education in the United States with a correlation coefficient (R) of -0.390 and weighted average of 96.7%. Similarly, the statistical analysis conducted on geographies consisting of 120,087,340 people shows a moderate positive correlation between the proportion of Pueblo and percentage of population with at least 2nd grade education in the United States with a correlation coefficient (R) of 0.495 and weighted average of 98.3%, a difference of 1.7%.
2nd Grade Correlation Summary
| Measurement | Immigrants from Bangladesh | Pueblo |
| Minimum | 90.2% | 96.5% |
| Maximum | 100.0% | 100.0% |
| Range | 9.8% | 3.5% |
| Mean | 96.7% | 99.3% |
| Median | 97.0% | 100.0% |
| Interquartile 25% (IQ1) | 95.7% | 98.7% |
| Interquartile 75% (IQ3) | 98.0% | 100.0% |
| Interquartile Range (IQR) | 2.3% | 1.3% |
| Standard Deviation (Sample) | 2.1% | 0.94% |
| Standard Deviation (Population) | 2.1% | 0.94% |
Similar Demographics by 2nd Grade
Demographics Similar to Immigrants from Bangladesh by 2nd Grade
In terms of 2nd grade, the demographic groups most similar to Immigrants from Bangladesh are Immigrants from Guyana (96.7%, a difference of 0.030%), Immigrants from Burma/Myanmar (96.7%, a difference of 0.030%), Vietnamese (96.7%, a difference of 0.030%), Honduran (96.7%, a difference of 0.040%), and Immigrants from Laos (96.7%, a difference of 0.040%).
| Demographics | Rating | Rank | 2nd Grade |
| Immigrants | Belize | 0.0 /100 | #315 | Tragic 96.8% |
| Hondurans | 0.0 /100 | #316 | Tragic 96.7% |
| Immigrants | Laos | 0.0 /100 | #317 | Tragic 96.7% |
| Indonesians | 0.0 /100 | #318 | Tragic 96.7% |
| Immigrants | Nicaragua | 0.0 /100 | #319 | Tragic 96.7% |
| Immigrants | Guyana | 0.0 /100 | #320 | Tragic 96.7% |
| Immigrants | Burma/Myanmar | 0.0 /100 | #321 | Tragic 96.7% |
| Immigrants | Bangladesh | 0.0 /100 | #322 | Tragic 96.7% |
| Vietnamese | 0.0 /100 | #323 | Tragic 96.7% |
| Mexican American Indians | 0.0 /100 | #324 | Tragic 96.7% |
| Dominicans | 0.0 /100 | #325 | Tragic 96.6% |
| Immigrants | Honduras | 0.0 /100 | #326 | Tragic 96.6% |
| Immigrants | Vietnam | 0.0 /100 | #327 | Tragic 96.5% |
| Mexicans | 0.0 /100 | #328 | Tragic 96.5% |
| Japanese | 0.0 /100 | #329 | Tragic 96.5% |
Demographics Similar to Pueblo by 2nd Grade
In terms of 2nd grade, the demographic groups most similar to Pueblo are Kiowa (98.3%, a difference of 0.0%), Immigrants from Scotland (98.3%, a difference of 0.0%), Celtic (98.4%, a difference of 0.010%), White/Caucasian (98.4%, a difference of 0.010%), and Estonian (98.4%, a difference of 0.010%).
| Demographics | Rating | Rank | 2nd Grade |
| Lumbee | 99.9 /100 | #46 | Exceptional 98.4% |
| Ottawa | 99.9 /100 | #47 | Exceptional 98.4% |
| Czechoslovakians | 99.9 /100 | #48 | Exceptional 98.4% |
| Celtics | 99.8 /100 | #49 | Exceptional 98.4% |
| Whites/Caucasians | 99.8 /100 | #50 | Exceptional 98.4% |
| Estonians | 99.8 /100 | #51 | Exceptional 98.4% |
| Australians | 99.8 /100 | #52 | Exceptional 98.4% |
| Pueblo | 99.8 /100 | #53 | Exceptional 98.3% |
| Kiowa | 99.8 /100 | #54 | Exceptional 98.3% |
| Immigrants | Scotland | 99.8 /100 | #55 | Exceptional 98.3% |
| Americans | 99.8 /100 | #56 | Exceptional 98.3% |
| Austrians | 99.8 /100 | #57 | Exceptional 98.3% |
| Bulgarians | 99.8 /100 | #58 | Exceptional 98.3% |
| Slavs | 99.8 /100 | #59 | Exceptional 98.3% |
| Creek | 99.8 /100 | #60 | Exceptional 98.3% |