Immigrants from Hong Kong vs Immigrants from Bolivia In Labor Force | Age 30-34
COMPARE
Immigrants from Hong Kong
Immigrants from Bolivia
In Labor Force | Age 30-34
In Labor Force | Age 30-34 Comparison
Immigrants from Hong Kong
Immigrants from Bolivia
85.8%
IN LABOR FORCE | AGE 30-34
100.0/ 100
METRIC RATING
30th/ 347
METRIC RANK
86.2%
IN LABOR FORCE | AGE 30-34
100.0/ 100
METRIC RATING
7th/ 347
METRIC RANK
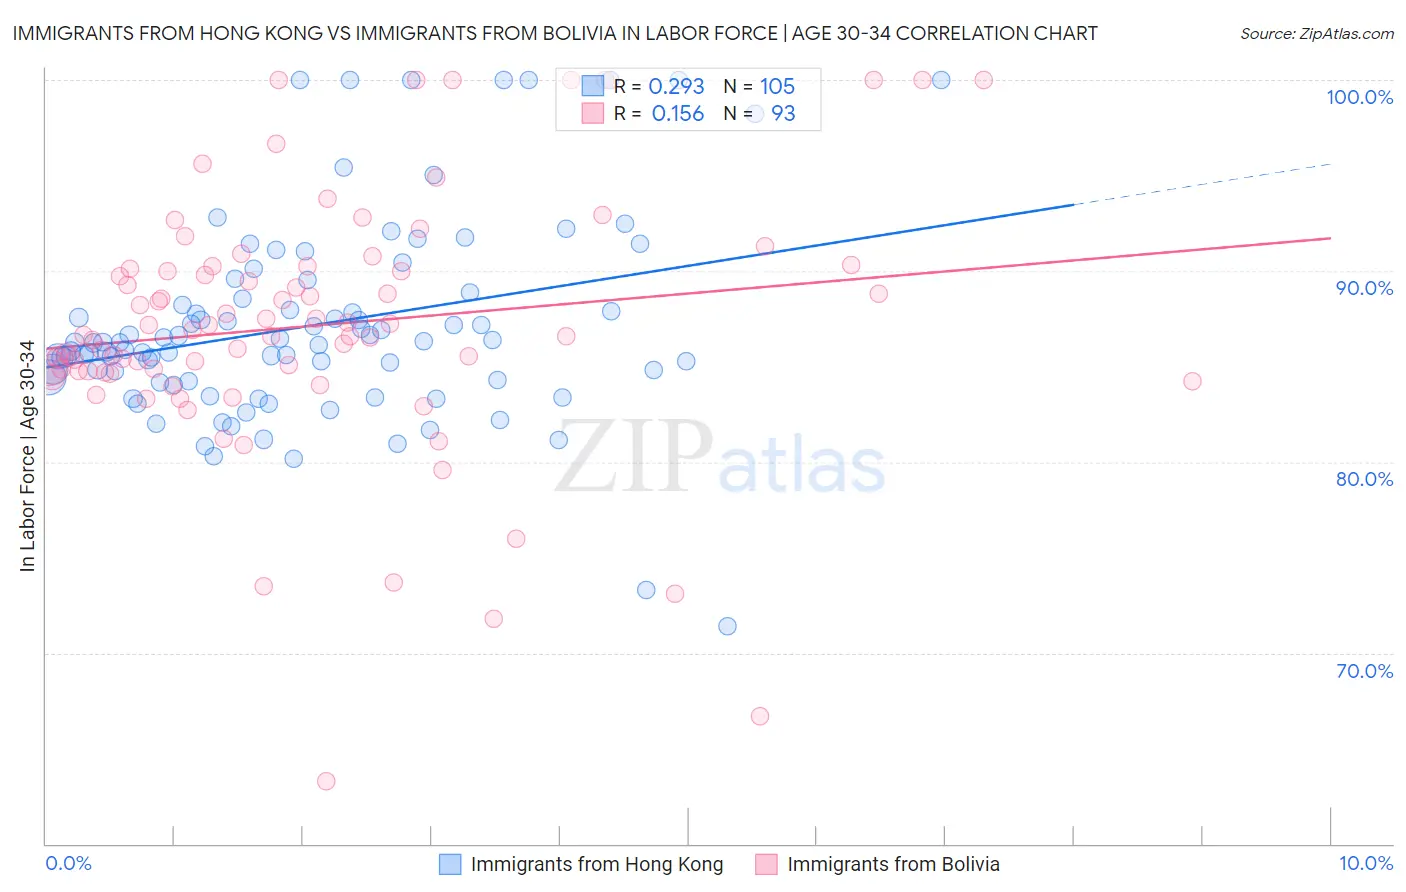
Immigrants from Hong Kong vs Immigrants from Bolivia In Labor Force | Age 30-34 Correlation Chart
The statistical analysis conducted on geographies consisting of 253,906,280 people shows a weak positive correlation between the proportion of Immigrants from Hong Kong and labor force participation rate among population between the ages 30 and 34 in the United States with a correlation coefficient (R) of 0.293 and weighted average of 85.8%. Similarly, the statistical analysis conducted on geographies consisting of 158,707,653 people shows a poor positive correlation between the proportion of Immigrants from Bolivia and labor force participation rate among population between the ages 30 and 34 in the United States with a correlation coefficient (R) of 0.156 and weighted average of 86.2%, a difference of 0.48%.
In Labor Force | Age 30-34 Correlation Summary
| Measurement | Immigrants from Hong Kong | Immigrants from Bolivia |
| Minimum | 71.4% | 63.3% |
| Maximum | 100.0% | 100.0% |
| Range | 28.6% | 36.7% |
| Mean | 87.2% | 87.1% |
| Median | 86.2% | 86.7% |
| Interquartile 25% (IQ1) | 84.3% | 84.7% |
| Interquartile 75% (IQ3) | 88.7% | 90.2% |
| Interquartile Range (IQR) | 4.5% | 5.5% |
| Standard Deviation (Sample) | 5.3% | 6.7% |
| Standard Deviation (Population) | 5.3% | 6.7% |
Similar Demographics by In Labor Force | Age 30-34
Demographics Similar to Immigrants from Hong Kong by In Labor Force | Age 30-34
In terms of in labor force | age 30-34, the demographic groups most similar to Immigrants from Hong Kong are Paraguayan (85.8%, a difference of 0.020%), Cypriot (85.8%, a difference of 0.020%), Tsimshian (85.8%, a difference of 0.040%), Immigrants from Latvia (85.9%, a difference of 0.060%), and Immigrants from Bosnia and Herzegovina (85.8%, a difference of 0.060%).
| Demographics | Rating | Rank | In Labor Force | Age 30-34 |
| Estonians | 100.0 /100 | #23 | Exceptional 85.9% |
| Immigrants | Eritrea | 100.0 /100 | #24 | Exceptional 85.9% |
| Immigrants | North Macedonia | 100.0 /100 | #25 | Exceptional 85.9% |
| Immigrants | Eastern Africa | 100.0 /100 | #26 | Exceptional 85.9% |
| Immigrants | Liberia | 100.0 /100 | #27 | Exceptional 85.9% |
| Immigrants | Latvia | 100.0 /100 | #28 | Exceptional 85.9% |
| Tsimshian | 100.0 /100 | #29 | Exceptional 85.8% |
| Immigrants | Hong Kong | 100.0 /100 | #30 | Exceptional 85.8% |
| Paraguayans | 99.9 /100 | #31 | Exceptional 85.8% |
| Cypriots | 99.9 /100 | #32 | Exceptional 85.8% |
| Immigrants | Bosnia and Herzegovina | 99.9 /100 | #33 | Exceptional 85.8% |
| Ugandans | 99.9 /100 | #34 | Exceptional 85.8% |
| Serbians | 99.9 /100 | #35 | Exceptional 85.8% |
| Albanians | 99.9 /100 | #36 | Exceptional 85.7% |
| Norwegians | 99.9 /100 | #37 | Exceptional 85.7% |
Demographics Similar to Immigrants from Bolivia by In Labor Force | Age 30-34
In terms of in labor force | age 30-34, the demographic groups most similar to Immigrants from Bolivia are Somali (86.2%, a difference of 0.010%), Cambodian (86.2%, a difference of 0.010%), Immigrants from Somalia (86.2%, a difference of 0.020%), Immigrants from Ireland (86.3%, a difference of 0.040%), and Immigrants from Serbia (86.2%, a difference of 0.060%).
| Demographics | Rating | Rank | In Labor Force | Age 30-34 |
| Luxembourgers | 100.0 /100 | #1 | Exceptional 86.6% |
| Ethiopians | 100.0 /100 | #2 | Exceptional 86.6% |
| Immigrants | Ethiopia | 100.0 /100 | #3 | Exceptional 86.6% |
| Liberians | 100.0 /100 | #4 | Exceptional 86.4% |
| Immigrants | Ireland | 100.0 /100 | #5 | Exceptional 86.3% |
| Somalis | 100.0 /100 | #6 | Exceptional 86.2% |
| Immigrants | Bolivia | 100.0 /100 | #7 | Exceptional 86.2% |
| Cambodians | 100.0 /100 | #8 | Exceptional 86.2% |
| Immigrants | Somalia | 100.0 /100 | #9 | Exceptional 86.2% |
| Immigrants | Serbia | 100.0 /100 | #10 | Exceptional 86.2% |
| Carpatho Rusyns | 100.0 /100 | #11 | Exceptional 86.2% |
| Bolivians | 100.0 /100 | #12 | Exceptional 86.1% |
| Immigrants | Croatia | 100.0 /100 | #13 | Exceptional 86.1% |
| Immigrants | Cabo Verde | 100.0 /100 | #14 | Exceptional 86.1% |
| Immigrants | Albania | 100.0 /100 | #15 | Exceptional 86.1% |