Native/Alaskan vs Haitian 5th Grade
COMPARE
Native/Alaskan
Haitian
5th Grade
5th Grade Comparison
Natives/Alaskans
Haitians
97.2%
5TH GRADE
18.0/ 100
METRIC RATING
199th/ 347
METRIC RANK
96.3%
5TH GRADE
0.0/ 100
METRIC RATING
297th/ 347
METRIC RANK
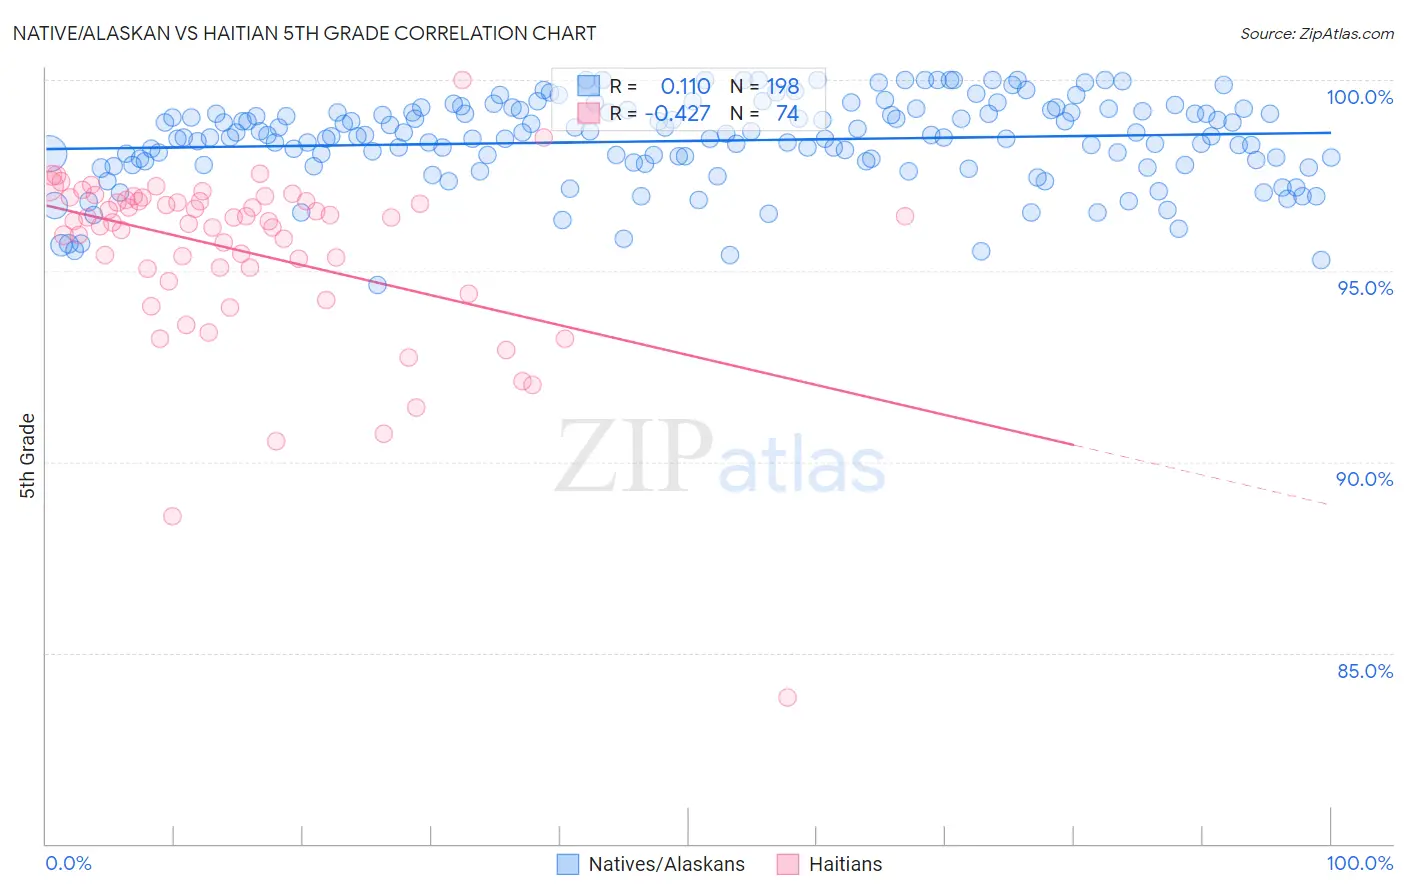
Native/Alaskan vs Haitian 5th Grade Correlation Chart
The statistical analysis conducted on geographies consisting of 513,072,444 people shows a poor positive correlation between the proportion of Natives/Alaskans and percentage of population with at least 5th grade education in the United States with a correlation coefficient (R) of 0.110 and weighted average of 97.2%. Similarly, the statistical analysis conducted on geographies consisting of 288,018,742 people shows a moderate negative correlation between the proportion of Haitians and percentage of population with at least 5th grade education in the United States with a correlation coefficient (R) of -0.427 and weighted average of 96.3%, a difference of 0.96%.
5th Grade Correlation Summary
| Measurement | Native/Alaskan | Haitian |
| Minimum | 94.6% | 83.8% |
| Maximum | 100.0% | 100.0% |
| Range | 5.4% | 16.2% |
| Mean | 98.4% | 95.5% |
| Median | 98.5% | 96.3% |
| Interquartile 25% (IQ1) | 97.8% | 95.1% |
| Interquartile 75% (IQ3) | 99.2% | 96.8% |
| Interquartile Range (IQR) | 1.3% | 1.8% |
| Standard Deviation (Sample) | 1.1% | 2.4% |
| Standard Deviation (Population) | 1.1% | 2.4% |
Similar Demographics by 5th Grade
Demographics Similar to Natives/Alaskans by 5th Grade
In terms of 5th grade, the demographic groups most similar to Natives/Alaskans are Immigrants from Northern Africa (97.2%, a difference of 0.010%), Immigrants from Chile (97.2%, a difference of 0.010%), Immigrants from Uganda (97.2%, a difference of 0.020%), African (97.2%, a difference of 0.020%), and Immigrants from Bahamas (97.2%, a difference of 0.020%).
| Demographics | Rating | Rank | 5th Grade |
| Panamanians | 31.3 /100 | #192 | Fair 97.3% |
| Navajo | 29.0 /100 | #193 | Fair 97.2% |
| Immigrants | Albania | 28.5 /100 | #194 | Fair 97.2% |
| Guamanians/Chamorros | 26.8 /100 | #195 | Fair 97.2% |
| Hawaiians | 25.6 /100 | #196 | Fair 97.2% |
| Brazilians | 25.4 /100 | #197 | Fair 97.2% |
| Immigrants | Uganda | 21.1 /100 | #198 | Fair 97.2% |
| Natives/Alaskans | 18.0 /100 | #199 | Poor 97.2% |
| Immigrants | Northern Africa | 16.8 /100 | #200 | Poor 97.2% |
| Immigrants | Chile | 16.6 /100 | #201 | Poor 97.2% |
| Africans | 15.3 /100 | #202 | Poor 97.2% |
| Immigrants | Bahamas | 14.9 /100 | #203 | Poor 97.2% |
| Immigrants | Zaire | 13.7 /100 | #204 | Poor 97.1% |
| Moroccans | 12.0 /100 | #205 | Poor 97.1% |
| Paiute | 11.6 /100 | #206 | Poor 97.1% |
Demographics Similar to Haitians by 5th Grade
In terms of 5th grade, the demographic groups most similar to Haitians are Immigrants from South Eastern Asia (96.3%, a difference of 0.030%), Immigrants from Dominica (96.2%, a difference of 0.050%), Immigrants (96.2%, a difference of 0.080%), Immigrants from Somalia (96.4%, a difference of 0.13%), and Sri Lankan (96.1%, a difference of 0.13%).
| Demographics | Rating | Rank | 5th Grade |
| British West Indians | 0.0 /100 | #290 | Tragic 96.5% |
| Malaysians | 0.0 /100 | #291 | Tragic 96.5% |
| Somalis | 0.0 /100 | #292 | Tragic 96.5% |
| Immigrants | Grenada | 0.0 /100 | #293 | Tragic 96.5% |
| Immigrants | Eritrea | 0.0 /100 | #294 | Tragic 96.4% |
| Immigrants | Somalia | 0.0 /100 | #295 | Tragic 96.4% |
| Immigrants | South Eastern Asia | 0.0 /100 | #296 | Tragic 96.3% |
| Haitians | 0.0 /100 | #297 | Tragic 96.3% |
| Immigrants | Dominica | 0.0 /100 | #298 | Tragic 96.2% |
| Immigrants | Immigrants | 0.0 /100 | #299 | Tragic 96.2% |
| Sri Lankans | 0.0 /100 | #300 | Tragic 96.1% |
| Immigrants | Cuba | 0.0 /100 | #301 | Tragic 96.1% |
| Guyanese | 0.0 /100 | #302 | Tragic 96.1% |
| Puerto Ricans | 0.0 /100 | #303 | Tragic 96.1% |
| Immigrants | Burma/Myanmar | 0.0 /100 | #304 | Tragic 96.1% |