Immigrants from Hong Kong vs Immigrants from Philippines 5th Grade
COMPARE
Immigrants from Hong Kong
Immigrants from Philippines
5th Grade
5th Grade Comparison
Immigrants from Hong Kong
Immigrants from Philippines
96.7%
5TH GRADE
0.2/ 100
METRIC RATING
271st/ 347
METRIC RANK
96.6%
5TH GRADE
0.1/ 100
METRIC RATING
279th/ 347
METRIC RANK
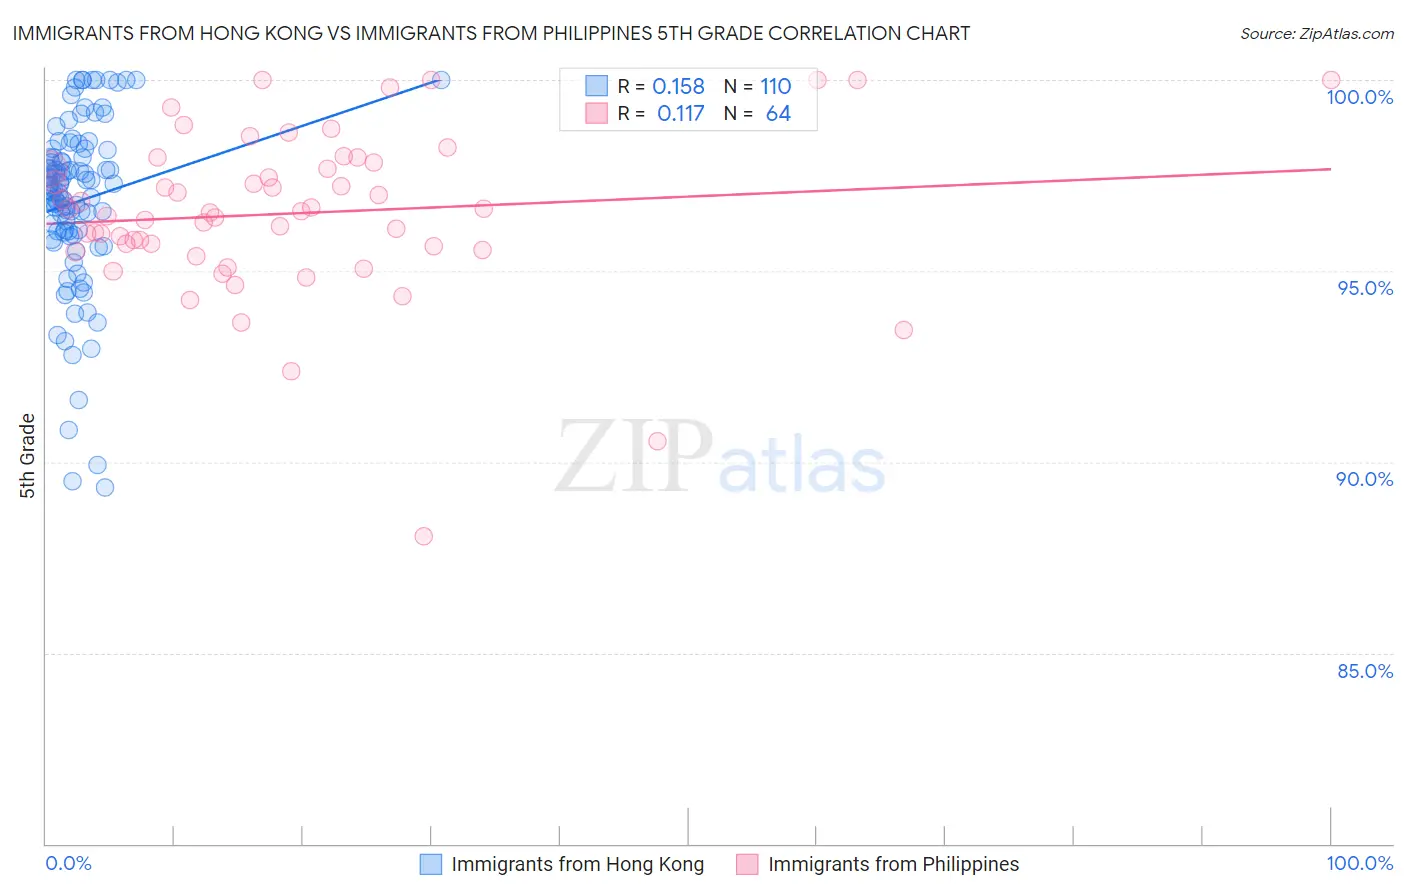
Immigrants from Hong Kong vs Immigrants from Philippines 5th Grade Correlation Chart
The statistical analysis conducted on geographies consisting of 253,908,350 people shows a poor positive correlation between the proportion of Immigrants from Hong Kong and percentage of population with at least 5th grade education in the United States with a correlation coefficient (R) of 0.158 and weighted average of 96.7%. Similarly, the statistical analysis conducted on geographies consisting of 471,303,531 people shows a poor positive correlation between the proportion of Immigrants from Philippines and percentage of population with at least 5th grade education in the United States with a correlation coefficient (R) of 0.117 and weighted average of 96.6%, a difference of 0.060%.
5th Grade Correlation Summary
| Measurement | Immigrants from Hong Kong | Immigrants from Philippines |
| Minimum | 89.3% | 88.1% |
| Maximum | 100.0% | 100.0% |
| Range | 10.7% | 11.9% |
| Mean | 96.8% | 96.5% |
| Median | 97.2% | 96.5% |
| Interquartile 25% (IQ1) | 96.0% | 95.6% |
| Interquartile 75% (IQ3) | 98.0% | 97.8% |
| Interquartile Range (IQR) | 2.0% | 2.2% |
| Standard Deviation (Sample) | 2.2% | 2.1% |
| Standard Deviation (Population) | 2.2% | 2.1% |
Demographics Similar to Immigrants from Hong Kong and Immigrants from Philippines by 5th Grade
In terms of 5th grade, the demographic groups most similar to Immigrants from Hong Kong are Afghan (96.7%, a difference of 0.0%), Trinidadian and Tobagonian (96.7%, a difference of 0.010%), Yaqui (96.7%, a difference of 0.020%), Immigrants from Cameroon (96.7%, a difference of 0.020%), and Immigrants from Peru (96.6%, a difference of 0.030%). Similarly, the demographic groups most similar to Immigrants from Philippines are Immigrants from Ghana (96.6%, a difference of 0.010%), Immigrants from Western Africa (96.6%, a difference of 0.010%), Houma (96.6%, a difference of 0.010%), Barbadian (96.6%, a difference of 0.010%), and Fijian (96.6%, a difference of 0.010%).
| Demographics | Rating | Rank | 5th Grade |
| Taiwanese | 0.3 /100 | #265 | Tragic 96.7% |
| Immigrants | Nigeria | 0.3 /100 | #266 | Tragic 96.7% |
| Immigrants | South America | 0.3 /100 | #267 | Tragic 96.7% |
| Armenians | 0.3 /100 | #268 | Tragic 96.7% |
| Ghanaians | 0.2 /100 | #269 | Tragic 96.7% |
| Afghans | 0.2 /100 | #270 | Tragic 96.7% |
| Immigrants | Hong Kong | 0.2 /100 | #271 | Tragic 96.7% |
| Trinidadians and Tobagonians | 0.1 /100 | #272 | Tragic 96.7% |
| Yaqui | 0.1 /100 | #273 | Tragic 96.7% |
| Immigrants | Cameroon | 0.1 /100 | #274 | Tragic 96.7% |
| Immigrants | Peru | 0.1 /100 | #275 | Tragic 96.6% |
| Cubans | 0.1 /100 | #276 | Tragic 96.6% |
| Immigrants | Bolivia | 0.1 /100 | #277 | Tragic 96.6% |
| Immigrants | Ghana | 0.1 /100 | #278 | Tragic 96.6% |
| Immigrants | Philippines | 0.1 /100 | #279 | Tragic 96.6% |
| Immigrants | Western Africa | 0.1 /100 | #280 | Tragic 96.6% |
| Houma | 0.1 /100 | #281 | Tragic 96.6% |
| Barbadians | 0.1 /100 | #282 | Tragic 96.6% |
| Fijians | 0.1 /100 | #283 | Tragic 96.6% |
| Immigrants | Trinidad and Tobago | 0.1 /100 | #284 | Tragic 96.6% |
| Immigrants | St. Vincent and the Grenadines | 0.1 /100 | #285 | Tragic 96.6% |