Immigrants from Honduras vs Bhutanese College, 1 year or more
COMPARE
Immigrants from Honduras
Bhutanese
College, 1 year or more
College, 1 year or more Comparison
Immigrants from Honduras
Bhutanese
51.0%
COLLEGE, 1 YEAR OR MORE
0.0/ 100
METRIC RATING
318th/ 347
METRIC RANK
64.6%
COLLEGE, 1 YEAR OR MORE
99.9/ 100
METRIC RATING
46th/ 347
METRIC RANK
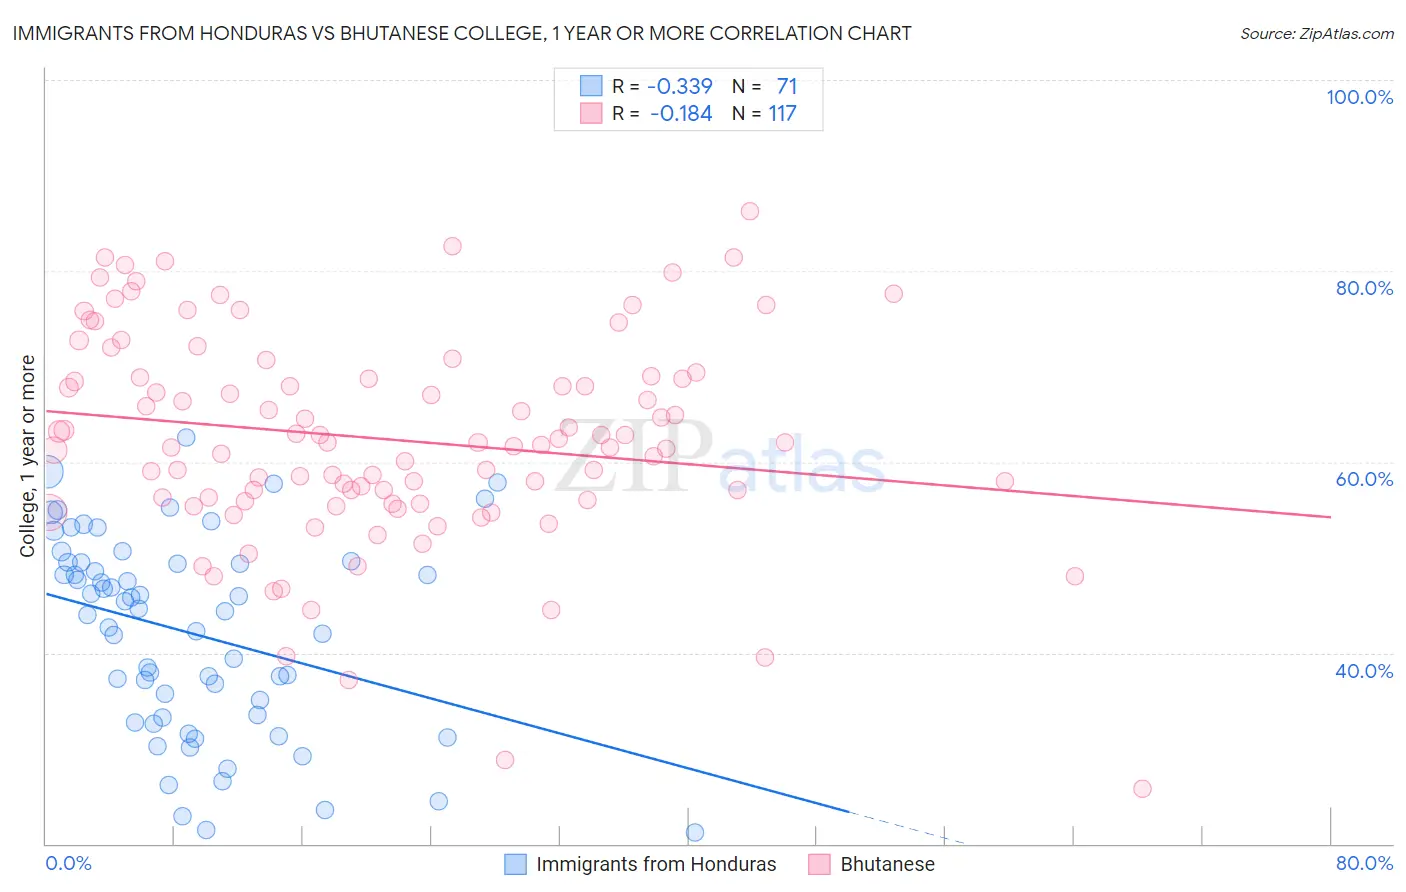
Immigrants from Honduras vs Bhutanese College, 1 year or more Correlation Chart
The statistical analysis conducted on geographies consisting of 322,637,082 people shows a mild negative correlation between the proportion of Immigrants from Honduras and percentage of population with at least college, 1 year or more education in the United States with a correlation coefficient (R) of -0.339 and weighted average of 51.0%. Similarly, the statistical analysis conducted on geographies consisting of 455,588,587 people shows a poor negative correlation between the proportion of Bhutanese and percentage of population with at least college, 1 year or more education in the United States with a correlation coefficient (R) of -0.184 and weighted average of 64.6%, a difference of 26.6%.
College, 1 year or more Correlation Summary
| Measurement | Immigrants from Honduras | Bhutanese |
| Minimum | 21.2% | 25.7% |
| Maximum | 62.6% | 86.2% |
| Range | 41.4% | 60.5% |
| Mean | 42.0% | 62.4% |
| Median | 44.4% | 62.0% |
| Interquartile 25% (IQ1) | 33.2% | 55.9% |
| Interquartile 75% (IQ3) | 49.4% | 69.0% |
| Interquartile Range (IQR) | 16.3% | 13.0% |
| Standard Deviation (Sample) | 10.3% | 11.1% |
| Standard Deviation (Population) | 10.2% | 11.1% |
Similar Demographics by College, 1 year or more
Demographics Similar to Immigrants from Honduras by College, 1 year or more
In terms of college, 1 year or more, the demographic groups most similar to Immigrants from Honduras are Immigrants from El Salvador (51.0%, a difference of 0.090%), Hispanic or Latino (51.1%, a difference of 0.13%), Kiowa (51.0%, a difference of 0.15%), Cajun (51.2%, a difference of 0.22%), and Hopi (50.9%, a difference of 0.27%).
| Demographics | Rating | Rank | College, 1 year or more |
| Immigrants | Haiti | 0.0 /100 | #311 | Tragic 51.5% |
| Pueblo | 0.0 /100 | #312 | Tragic 51.5% |
| Immigrants | Caribbean | 0.0 /100 | #313 | Tragic 51.4% |
| Fijians | 0.0 /100 | #314 | Tragic 51.3% |
| Guatemalans | 0.0 /100 | #315 | Tragic 51.2% |
| Cajuns | 0.0 /100 | #316 | Tragic 51.2% |
| Hispanics or Latinos | 0.0 /100 | #317 | Tragic 51.1% |
| Immigrants | Honduras | 0.0 /100 | #318 | Tragic 51.0% |
| Immigrants | El Salvador | 0.0 /100 | #319 | Tragic 51.0% |
| Kiowa | 0.0 /100 | #320 | Tragic 51.0% |
| Hopi | 0.0 /100 | #321 | Tragic 50.9% |
| Navajo | 0.0 /100 | #322 | Tragic 50.8% |
| Immigrants | Guatemala | 0.0 /100 | #323 | Tragic 50.7% |
| Immigrants | Cuba | 0.0 /100 | #324 | Tragic 50.7% |
| Immigrants | Latin America | 0.0 /100 | #325 | Tragic 50.7% |
Demographics Similar to Bhutanese by College, 1 year or more
In terms of college, 1 year or more, the demographic groups most similar to Bhutanese are Immigrants from Lithuania (64.6%, a difference of 0.010%), Australian (64.6%, a difference of 0.010%), Immigrants from Bulgaria (64.6%, a difference of 0.040%), New Zealander (64.6%, a difference of 0.070%), and Immigrants from Norway (64.7%, a difference of 0.18%).
| Demographics | Rating | Rank | College, 1 year or more |
| Estonians | 99.9 /100 | #39 | Exceptional 65.0% |
| Immigrants | Kuwait | 99.9 /100 | #40 | Exceptional 65.0% |
| Mongolians | 99.9 /100 | #41 | Exceptional 64.8% |
| Immigrants | Latvia | 99.9 /100 | #42 | Exceptional 64.8% |
| Immigrants | Russia | 99.9 /100 | #43 | Exceptional 64.7% |
| Immigrants | Norway | 99.9 /100 | #44 | Exceptional 64.7% |
| Immigrants | Lithuania | 99.9 /100 | #45 | Exceptional 64.6% |
| Bhutanese | 99.9 /100 | #46 | Exceptional 64.6% |
| Australians | 99.9 /100 | #47 | Exceptional 64.6% |
| Immigrants | Bulgaria | 99.9 /100 | #48 | Exceptional 64.6% |
| New Zealanders | 99.9 /100 | #49 | Exceptional 64.6% |
| Immigrants | Austria | 99.8 /100 | #50 | Exceptional 64.4% |
| Immigrants | Malaysia | 99.8 /100 | #51 | Exceptional 64.3% |
| Immigrants | Netherlands | 99.8 /100 | #52 | Exceptional 64.2% |
| Asians | 99.8 /100 | #53 | Exceptional 64.2% |