Egyptian vs Bhutanese College, 1 year or more

COMPARE

Egyptian
Race
Ancestry
AfghanAfricanAlaska NativeAlaskan AthabascanAlbanianAleutAlsatianAmericanApacheArabArapahoArgentineanArmenianAssyrian/Chaldean/SyriacAustralianAustrianBahamianBangladeshiBarbadianBasqueBelgianBelizeanBermudanBlackfeetBolivianBrazilianBritishBritish West IndianBulgarianBurmeseCajunCambodianCanadianCape VerdeanCarpatho RusynCelticCentral AmericanCentral American IndianCherokeeCheyenneChickasawChileanChineseChippewaChoctawColombianColvilleComancheCosta RicanCreeCreekCroatianCrowCubanCypriotCzechCzechoslovakianDanishDelawareDominicanDutchDutch West IndianEastern EuropeanEcuadorianEgyptianEnglishEstonianEthiopianEuropeanFijianFilipinoFinnishFrenchFrench American IndianFrench CanadianGermanGerman RussianGhanaianGreekGuamanian/ChamorroGuatemalanGuyaneseHaitianHmongHonduranHopiHoumaHungarianIcelanderIndian (Asian)IndonesianInupiatIranianIraqiIrishIroquoisIsraeliItalianJamaicanJapaneseJordanianKenyanKiowaKoreanLaotianLatvianLebaneseLiberianLithuanianLumbeeLuxembourgerMacedonianMalaysianMalteseMarshalleseMenomineeMexicanMexican American IndianMongolianMoroccanNative HawaiianNavajoNepaleseNew ZealanderNicaraguanNigerianNorthern EuropeanNorwegianOkinawanOsageOttawaPaiutePakistaniPalestinianPanamanianParaguayanPennsylvania GermanPeruvianPimaPolishPortuguesePotawatomiPuebloPuerto RicanPuget Sound SalishRomanianRussianSalvadoranSamoanScandinavianScotch-IrishScottishSeminoleSenegaleseSerbianShoshoneSierra LeoneanSiouxSlavicSlovakSloveneSomaliSouth AfricanSouth AmericanSouth American IndianSoviet UnionSpaniardSpanishSpanish AmericanSpanish American IndianSri LankanSubsaharan AfricanSudaneseSwedishSwissSyrianTaiwaneseThaiTlingit-HaidaTohono O'OdhamTonganTrinidadian and TobagonianTsimshianTurkishU.S. Virgin IslanderUgandanUkrainianUruguayanUteVenezuelanVietnameseWelshWest IndianYakamaYaquiYugoslavianYumanYup'ikZimbabwean
Immigration
NonimmigrantsImmigrantsAfghanistanAfricaAlbaniaArgentinaArmeniaAsiaAustraliaAustriaBahamasBangladeshBarbadosBelarusBelgiumBelizeBoliviaBosnia and HerzegovinaBrazilBulgariaBurma/MyanmarCabo VerdeCambodiaCameroonCanadaCaribbeanCentral AmericaChileChinaColombiaCongoCosta RicaCroatiaCubaCzechoslovakiaDenmarkDominicaDominican RepublicEastern AfricaEastern AsiaEastern EuropeEcuadorEgyptEl SalvadorEnglandEritreaEthiopiaEuropeFijiFranceGermanyGhanaGreeceGrenadaGuatemalaGuyanaHaitiHondurasHong KongHungaryIndiaIndonesiaIranIraqIrelandIsraelItalyJamaicaJapanJordanKazakhstanKenyaKoreaKuwaitLaosLatin AmericaLatviaLebanonLiberiaLithuaniaMalaysiaMexicoMicronesiaMiddle AfricaMoldovaMoroccoNepalNetherlandsNicaraguaNigeriaNorth AmericaNorth MacedoniaNorthern AfricaNorthern EuropeNorwayOceaniaPakistanPanamaPeruPhilippinesPolandPortugalRomaniaRussiaSaudi ArabiaScotlandSenegalSerbiaSierra LeoneSingaporeSomaliaSouth AfricaSouth AmericaSouth Central AsiaSouth Eastern AsiaSouthern EuropeSpainSri LankaSt. Vincent and the GrenadinesSudanSwedenSwitzerlandSyriaTaiwanThailandTrinidad and TobagoTurkeyUgandaUkraineUruguayUzbekistanVenezuelaVietnamWest IndiesWestern AfricaWestern AsiaWestern EuropeYemenZaireZimbabweAzores
Bhutanese
Race
Ancestry
AfghanAfricanAlaska NativeAlaskan AthabascanAlbanianAleutAlsatianAmericanApacheArabArapahoArgentineanArmenianAssyrian/Chaldean/SyriacAustralianAustrianBahamianBangladeshiBarbadianBasqueBelgianBelizeanBermudanBhutaneseBlackfeetBolivianBrazilianBritishBritish West IndianBulgarianBurmeseCajunCambodianCanadianCape VerdeanCarpatho RusynCelticCentral AmericanCentral American IndianCherokeeCheyenneChickasawChileanChineseChippewaChoctawColombianColvilleComancheCosta RicanCreeCreekCroatianCrowCubanCypriotCzechCzechoslovakianDanishDelawareDominicanDutchDutch West IndianEastern EuropeanEcuadorianEnglishEstonianEthiopianEuropeanFijianFilipinoFinnishFrenchFrench American IndianFrench CanadianGermanGerman RussianGhanaianGreekGuamanian/ChamorroGuatemalanGuyaneseHaitianHmongHonduranHopiHoumaHungarianIcelanderIndian (Asian)IndonesianInupiatIranianIraqiIrishIroquoisIsraeliItalianJamaicanJapaneseJordanianKenyanKiowaKoreanLaotianLatvianLebaneseLiberianLithuanianLumbeeLuxembourgerMacedonianMalaysianMalteseMarshalleseMenomineeMexicanMexican American IndianMongolianMoroccanNative HawaiianNavajoNepaleseNew ZealanderNicaraguanNigerianNorthern EuropeanNorwegianOkinawanOsageOttawaPaiutePakistaniPalestinianPanamanianParaguayanPennsylvania GermanPeruvianPimaPolishPortuguesePotawatomiPuebloPuerto RicanPuget Sound SalishRomanianRussianSalvadoranSamoanScandinavianScotch-IrishScottishSeminoleSenegaleseSerbianShoshoneSierra LeoneanSiouxSlavicSlovakSloveneSomaliSouth AfricanSouth AmericanSouth American IndianSoviet UnionSpaniardSpanishSpanish AmericanSpanish American IndianSri LankanSubsaharan AfricanSudaneseSwedishSwissSyrianTaiwaneseThaiTlingit-HaidaTohono O'OdhamTonganTrinidadian and TobagonianTsimshianTurkishU.S. Virgin IslanderUgandanUkrainianUruguayanUteVenezuelanVietnameseWelshWest IndianYakamaYaquiYugoslavianYumanYup'ikZimbabwean
Immigration
NonimmigrantsImmigrantsAfghanistanAfricaAlbaniaArgentinaArmeniaAsiaAustraliaAustriaBahamasBangladeshBarbadosBelarusBelgiumBelizeBoliviaBosnia and HerzegovinaBrazilBulgariaBurma/MyanmarCabo VerdeCambodiaCameroonCanadaCaribbeanCentral AmericaChileChinaColombiaCongoCosta RicaCroatiaCubaCzechoslovakiaDenmarkDominicaDominican RepublicEastern AfricaEastern AsiaEastern EuropeEcuadorEgyptEl SalvadorEnglandEritreaEthiopiaEuropeFijiFranceGermanyGhanaGreeceGrenadaGuatemalaGuyanaHaitiHondurasHong KongHungaryIndiaIndonesiaIranIraqIrelandIsraelItalyJamaicaJapanJordanKazakhstanKenyaKoreaKuwaitLaosLatin AmericaLatviaLebanonLiberiaLithuaniaMalaysiaMexicoMicronesiaMiddle AfricaMoldovaMoroccoNepalNetherlandsNicaraguaNigeriaNorth AmericaNorth MacedoniaNorthern AfricaNorthern EuropeNorwayOceaniaPakistanPanamaPeruPhilippinesPolandPortugalRomaniaRussiaSaudi ArabiaScotlandSenegalSerbiaSierra LeoneSingaporeSomaliaSouth AfricaSouth AmericaSouth Central AsiaSouth Eastern AsiaSouthern EuropeSpainSri LankaSt. Vincent and the GrenadinesSudanSwedenSwitzerlandSyriaTaiwanThailandTrinidad and TobagoTurkeyUgandaUkraineUruguayUzbekistanVenezuelaVietnamWest IndiesWestern AfricaWestern AsiaWestern EuropeYemenZaireZimbabweAzores
College, 1 year or more
Income
Poverty
Unemployment
Labor Participation
Family Structure
Vehicle Availability
Education Level
Disability

College, 1 year or more Comparison

Egyptians

Bhutanese

Exceptional
Exceptional
63.1%
COLLEGE, 1 YEAR OR MORE
99.0/ 100
METRIC RATING
72nd/ 347
METRIC RANK
64.6%
COLLEGE, 1 YEAR OR MORE
99.9/ 100
METRIC RATING
46th/ 347
METRIC RANK

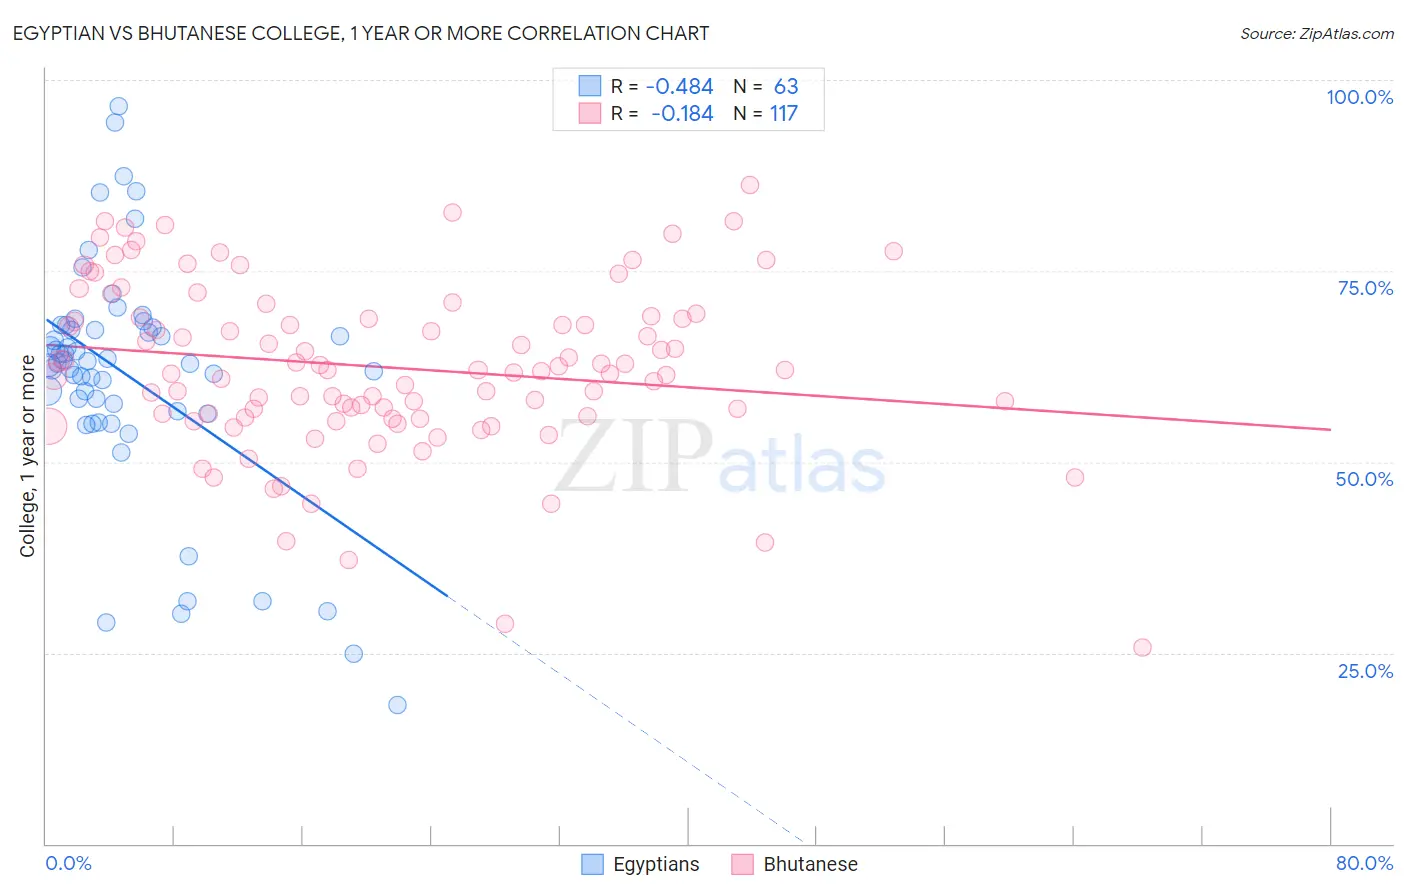
Egyptian vs Bhutanese College, 1 year or more Correlation Chart

The statistical analysis conducted on geographies consisting of 276,926,367 people shows a moderate negative correlation between the proportion of Egyptians and percentage of population with at least college, 1 year or more education in the United States with a correlation coefficient (R) of -0.484 and weighted average of 63.1%. Similarly, the statistical analysis conducted on geographies consisting of 455,588,587 people shows a poor negative correlation between the proportion of Bhutanese and percentage of population with at least college, 1 year or more education in the United States with a correlation coefficient (R) of -0.184 and weighted average of 64.6%, a difference of 2.5%.
Egyptian vs Bhutanese College, 1 year or more

College, 1 year or more Correlation Summary

MeasurementEgyptianBhutanese
Minimum18.2%25.7%
Maximum96.6%86.2%
Range78.4%60.5%
Mean61.3%62.4%
Median62.9%62.0%
Interquartile 25% (IQ1)56.7%55.9%
Interquartile 75% (IQ3)67.5%69.0%
Interquartile Range (IQR)10.9%13.0%
Standard Deviation (Sample)15.4%11.1%
Standard Deviation (Population)15.3%11.1%

Similar Demographics by College, 1 year or more

Demographics Similar to Egyptians by College, 1 year or more

In terms of college, 1 year or more, the demographic groups most similar to Egyptians are Immigrants from Moldova (63.0%, a difference of 0.010%), Immigrants from North America (63.0%, a difference of 0.030%), Immigrants from Canada (63.1%, a difference of 0.060%), Armenian (63.0%, a difference of 0.12%), and Paraguayan (62.9%, a difference of 0.22%).
DemographicsRating | RankCollege, 1 year or more
Maltese
99.3
/100
|
#65
Exceptional
63.4%
Immigrants | Europe
99.3
/100
|
#66
Exceptional
63.3%
Immigrants | Romania
99.3
/100
|
#67
Exceptional
63.3%
Immigrants | Greece
99.3
/100
|
#68
Exceptional
63.3%
Immigrants | Zimbabwe
99.3
/100
|
#69
Exceptional
63.3%
Argentineans
99.2
/100
|
#70
Exceptional
63.2%
Immigrants | Canada
99.1
/100
|
#71
Exceptional
63.1%
Egyptians
99.0
/100
|
#72
Exceptional
63.1%
Immigrants | Moldova
99.0
/100
|
#73
Exceptional
63.0%
Immigrants | North America
99.0
/100
|
#74
Exceptional
63.0%
Armenians
98.9
/100
|
#75
Exceptional
63.0%
Paraguayans
98.8
/100
|
#76
Exceptional
62.9%
Ethiopians
98.8
/100
|
#77
Exceptional
62.9%
Immigrants | Lebanon
98.8
/100
|
#78
Exceptional
62.9%
Northern Europeans
98.8
/100
|
#79
Exceptional
62.9%

Demographics Similar to Bhutanese by College, 1 year or more

In terms of college, 1 year or more, the demographic groups most similar to Bhutanese are Immigrants from Lithuania (64.6%, a difference of 0.010%), Australian (64.6%, a difference of 0.010%), Immigrants from Bulgaria (64.6%, a difference of 0.040%), New Zealander (64.6%, a difference of 0.070%), and Immigrants from Norway (64.7%, a difference of 0.18%).
DemographicsRating | RankCollege, 1 year or more
Estonians
99.9
/100
|
#39
Exceptional
65.0%
Immigrants | Kuwait
99.9
/100
|
#40
Exceptional
65.0%
Mongolians
99.9
/100
|
#41
Exceptional
64.8%
Immigrants | Latvia
99.9
/100
|
#42
Exceptional
64.8%
Immigrants | Russia
99.9
/100
|
#43
Exceptional
64.7%
Immigrants | Norway
99.9
/100
|
#44
Exceptional
64.7%
Immigrants | Lithuania
99.9
/100
|
#45
Exceptional
64.6%
Bhutanese
99.9
/100
|
#46
Exceptional
64.6%
Australians
99.9
/100
|
#47
Exceptional
64.6%
Immigrants | Bulgaria
99.9
/100
|
#48
Exceptional
64.6%
New Zealanders
99.9
/100
|
#49
Exceptional
64.6%
Immigrants | Austria
99.8
/100
|
#50
Exceptional
64.4%
Immigrants | Malaysia
99.8
/100
|
#51
Exceptional
64.3%
Immigrants | Netherlands
99.8
/100
|
#52
Exceptional
64.2%
Asians
99.8
/100
|
#53
Exceptional
64.2%