Immigrants from Guyana vs Korean 4th Grade
COMPARE
Immigrants from Guyana
Korean
4th Grade
4th Grade Comparison
Immigrants from Guyana
Koreans
96.3%
4TH GRADE
0.0/ 100
METRIC RATING
309th/ 347
METRIC RANK
97.1%
4TH GRADE
1.3/ 100
METRIC RATING
244th/ 347
METRIC RANK
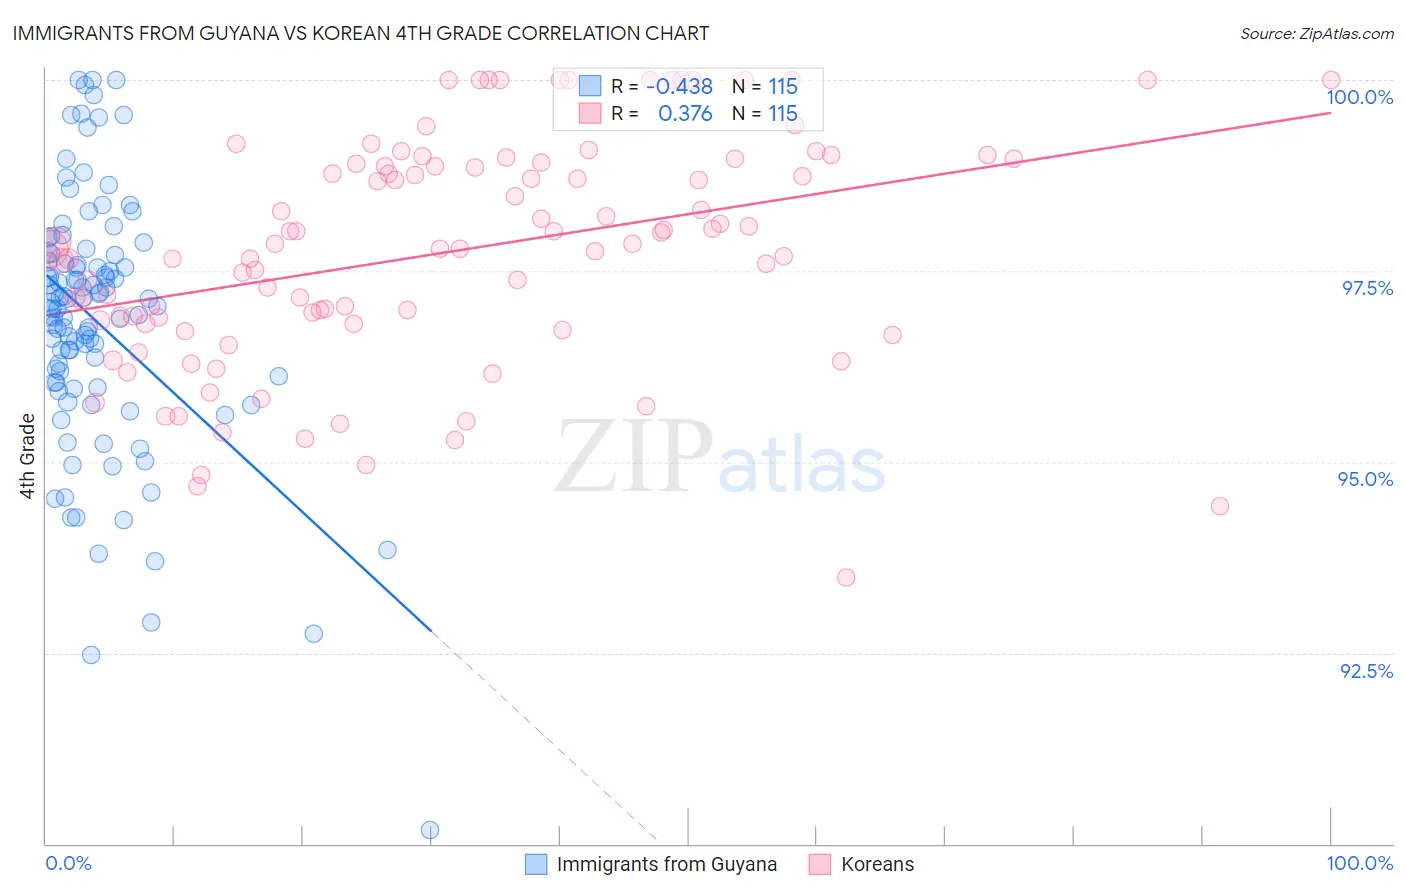
Immigrants from Guyana vs Korean 4th Grade Correlation Chart
The statistical analysis conducted on geographies consisting of 183,673,461 people shows a moderate negative correlation between the proportion of Immigrants from Guyana and percentage of population with at least 4th grade education in the United States with a correlation coefficient (R) of -0.438 and weighted average of 96.3%. Similarly, the statistical analysis conducted on geographies consisting of 510,939,806 people shows a mild positive correlation between the proportion of Koreans and percentage of population with at least 4th grade education in the United States with a correlation coefficient (R) of 0.376 and weighted average of 97.1%, a difference of 0.83%.
4th Grade Correlation Summary
| Measurement | Immigrants from Guyana | Korean |
| Minimum | 90.2% | 93.5% |
| Maximum | 100.0% | 100.0% |
| Range | 9.8% | 6.5% |
| Mean | 96.8% | 97.7% |
| Median | 97.0% | 97.8% |
| Interquartile 25% (IQ1) | 96.0% | 96.8% |
| Interquartile 75% (IQ3) | 97.7% | 98.9% |
| Interquartile Range (IQR) | 1.7% | 2.1% |
| Standard Deviation (Sample) | 1.7% | 1.5% |
| Standard Deviation (Population) | 1.7% | 1.5% |
Similar Demographics by 4th Grade
Demographics Similar to Immigrants from Guyana by 4th Grade
In terms of 4th grade, the demographic groups most similar to Immigrants from Guyana are Immigrants from Laos (96.3%, a difference of 0.0%), Immigrants from Haiti (96.3%, a difference of 0.010%), Immigrants from Burma/Myanmar (96.3%, a difference of 0.020%), Sri Lankan (96.4%, a difference of 0.040%), and Immigrants from Caribbean (96.4%, a difference of 0.050%).
| Demographics | Rating | Rank | 4th Grade |
| Immigrants | Cuba | 0.0 /100 | #302 | Tragic 96.4% |
| Guyanese | 0.0 /100 | #303 | Tragic 96.4% |
| Ecuadorians | 0.0 /100 | #304 | Tragic 96.4% |
| Immigrants | Caribbean | 0.0 /100 | #305 | Tragic 96.4% |
| Sri Lankans | 0.0 /100 | #306 | Tragic 96.4% |
| Immigrants | Haiti | 0.0 /100 | #307 | Tragic 96.3% |
| Immigrants | Laos | 0.0 /100 | #308 | Tragic 96.3% |
| Immigrants | Guyana | 0.0 /100 | #309 | Tragic 96.3% |
| Immigrants | Burma/Myanmar | 0.0 /100 | #310 | Tragic 96.3% |
| Immigrants | Bangladesh | 0.0 /100 | #311 | Tragic 96.2% |
| Cape Verdeans | 0.0 /100 | #312 | Tragic 96.2% |
| Indonesians | 0.0 /100 | #313 | Tragic 96.2% |
| Vietnamese | 0.0 /100 | #314 | Tragic 96.2% |
| Nicaraguans | 0.0 /100 | #315 | Tragic 96.2% |
| Immigrants | Ecuador | 0.0 /100 | #316 | Tragic 96.2% |
Demographics Similar to Koreans by 4th Grade
In terms of 4th grade, the demographic groups most similar to Koreans are Immigrants from Eastern Africa (97.1%, a difference of 0.0%), Immigrants from Uruguay (97.1%, a difference of 0.0%), Ethiopian (97.1%, a difference of 0.0%), Asian (97.1%, a difference of 0.010%), and U.S. Virgin Islander (97.1%, a difference of 0.010%).
| Demographics | Rating | Rank | 4th Grade |
| Immigrants | Costa Rica | 2.0 /100 | #237 | Tragic 97.2% |
| Indians (Asian) | 1.9 /100 | #238 | Tragic 97.2% |
| Nigerians | 1.8 /100 | #239 | Tragic 97.1% |
| Colombians | 1.6 /100 | #240 | Tragic 97.1% |
| Immigrants | Indonesia | 1.5 /100 | #241 | Tragic 97.1% |
| Asians | 1.4 /100 | #242 | Tragic 97.1% |
| U.S. Virgin Islanders | 1.4 /100 | #243 | Tragic 97.1% |
| Koreans | 1.3 /100 | #244 | Tragic 97.1% |
| Immigrants | Eastern Africa | 1.2 /100 | #245 | Tragic 97.1% |
| Immigrants | Uruguay | 1.2 /100 | #246 | Tragic 97.1% |
| Ethiopians | 1.2 /100 | #247 | Tragic 97.1% |
| Immigrants | Asia | 1.2 /100 | #248 | Tragic 97.1% |
| Immigrants | Africa | 1.0 /100 | #249 | Tragic 97.1% |
| Immigrants | Senegal | 0.9 /100 | #250 | Tragic 97.1% |
| South Americans | 0.8 /100 | #251 | Tragic 97.1% |