Immigrants from South Central Asia vs Immigrants from Ecuador 11th Grade
COMPARE
Immigrants from South Central Asia
Immigrants from Ecuador
11th Grade
11th Grade Comparison
Immigrants from South Central Asia
Immigrants from Ecuador
93.6%
11TH GRADE
99.2/ 100
METRIC RATING
86th/ 347
METRIC RANK
89.1%
11TH GRADE
0.0/ 100
METRIC RATING
315th/ 347
METRIC RANK
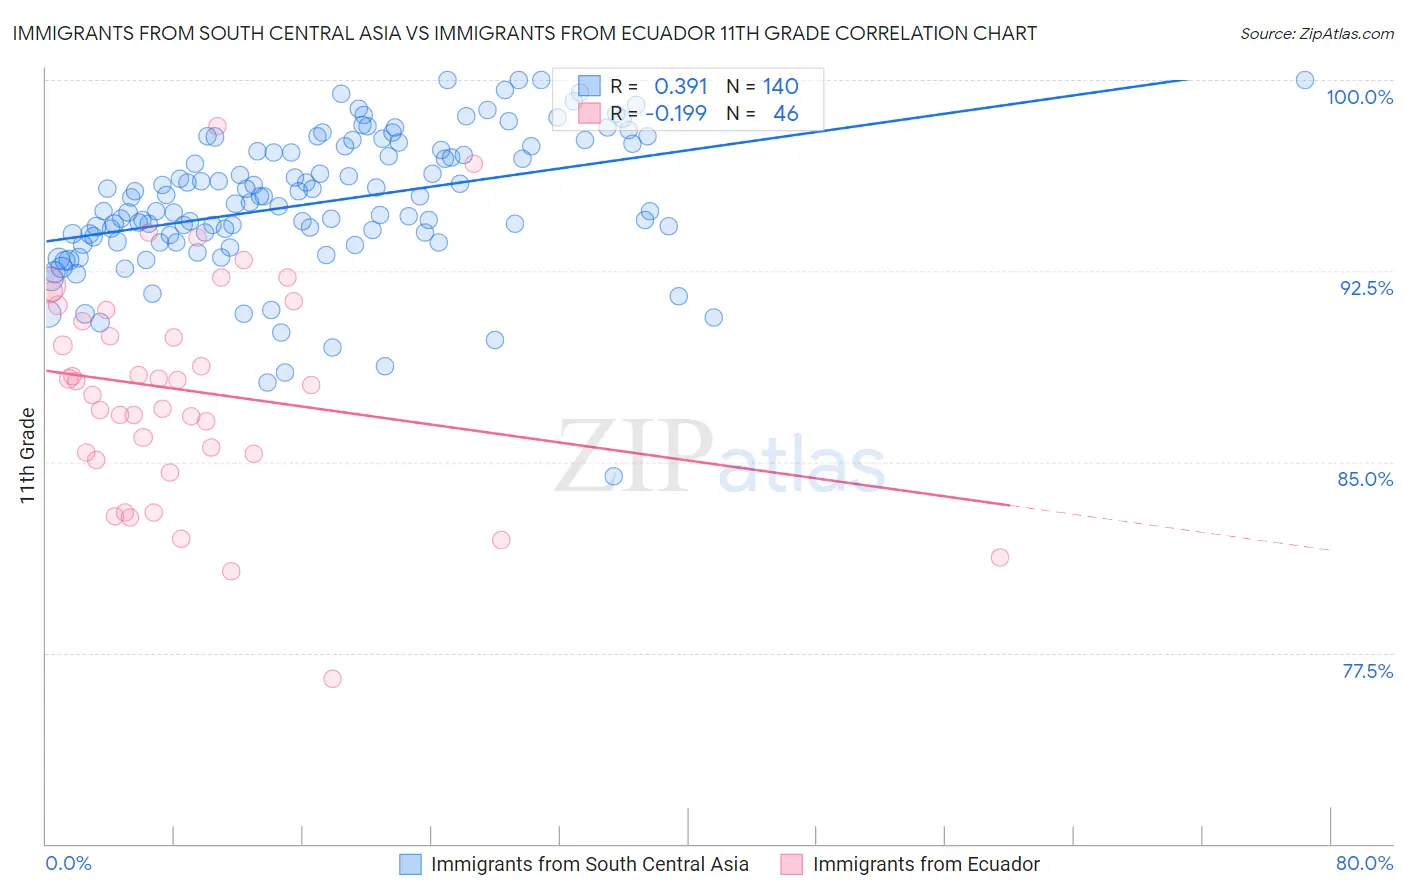
Immigrants from South Central Asia vs Immigrants from Ecuador 11th Grade Correlation Chart
The statistical analysis conducted on geographies consisting of 473,050,460 people shows a mild positive correlation between the proportion of Immigrants from South Central Asia and percentage of population with at least 11th grade education in the United States with a correlation coefficient (R) of 0.391 and weighted average of 93.6%. Similarly, the statistical analysis conducted on geographies consisting of 270,907,929 people shows a poor negative correlation between the proportion of Immigrants from Ecuador and percentage of population with at least 11th grade education in the United States with a correlation coefficient (R) of -0.199 and weighted average of 89.1%, a difference of 5.1%.
11th Grade Correlation Summary
| Measurement | Immigrants from South Central Asia | Immigrants from Ecuador |
| Minimum | 84.4% | 76.5% |
| Maximum | 100.0% | 98.2% |
| Range | 15.6% | 21.7% |
| Mean | 95.2% | 87.8% |
| Median | 95.2% | 88.1% |
| Interquartile 25% (IQ1) | 93.8% | 85.3% |
| Interquartile 75% (IQ3) | 97.3% | 91.0% |
| Interquartile Range (IQR) | 3.6% | 5.7% |
| Standard Deviation (Sample) | 2.7% | 4.3% |
| Standard Deviation (Population) | 2.7% | 4.3% |
Similar Demographics by 11th Grade
Demographics Similar to Immigrants from South Central Asia by 11th Grade
In terms of 11th grade, the demographic groups most similar to Immigrants from South Central Asia are Immigrants from Western Europe (93.6%, a difference of 0.0%), Cambodian (93.6%, a difference of 0.0%), Burmese (93.6%, a difference of 0.0%), Icelander (93.6%, a difference of 0.010%), and Immigrants from Taiwan (93.6%, a difference of 0.010%).
| Demographics | Rating | Rank | 11th Grade |
| Immigrants | Denmark | 99.5 /100 | #79 | Exceptional 93.7% |
| Canadians | 99.5 /100 | #80 | Exceptional 93.7% |
| Immigrants | Moldova | 99.5 /100 | #81 | Exceptional 93.7% |
| Immigrants | Saudi Arabia | 99.3 /100 | #82 | Exceptional 93.7% |
| Icelanders | 99.3 /100 | #83 | Exceptional 93.6% |
| Immigrants | Taiwan | 99.3 /100 | #84 | Exceptional 93.6% |
| Immigrants | Switzerland | 99.3 /100 | #85 | Exceptional 93.6% |
| Immigrants | South Central Asia | 99.2 /100 | #86 | Exceptional 93.6% |
| Immigrants | Western Europe | 99.2 /100 | #87 | Exceptional 93.6% |
| Cambodians | 99.2 /100 | #88 | Exceptional 93.6% |
| Burmese | 99.2 /100 | #89 | Exceptional 93.6% |
| Ottawa | 99.2 /100 | #90 | Exceptional 93.6% |
| South Africans | 99.2 /100 | #91 | Exceptional 93.6% |
| Immigrants | Bulgaria | 99.1 /100 | #92 | Exceptional 93.6% |
| Puget Sound Salish | 99.1 /100 | #93 | Exceptional 93.6% |
Demographics Similar to Immigrants from Ecuador by 11th Grade
In terms of 11th grade, the demographic groups most similar to Immigrants from Ecuador are Cape Verdean (89.1%, a difference of 0.010%), Immigrants from Caribbean (89.1%, a difference of 0.030%), Immigrants from Cuba (88.9%, a difference of 0.15%), Lumbee (88.9%, a difference of 0.16%), and Nicaraguan (88.9%, a difference of 0.22%).
| Demographics | Rating | Rank | 11th Grade |
| Nepalese | 0.0 /100 | #308 | Tragic 89.5% |
| Immigrants | Bangladesh | 0.0 /100 | #309 | Tragic 89.5% |
| Yaqui | 0.0 /100 | #310 | Tragic 89.5% |
| Vietnamese | 0.0 /100 | #311 | Tragic 89.4% |
| Immigrants | Portugal | 0.0 /100 | #312 | Tragic 89.3% |
| Immigrants | Caribbean | 0.0 /100 | #313 | Tragic 89.1% |
| Cape Verdeans | 0.0 /100 | #314 | Tragic 89.1% |
| Immigrants | Ecuador | 0.0 /100 | #315 | Tragic 89.1% |
| Immigrants | Cuba | 0.0 /100 | #316 | Tragic 88.9% |
| Lumbee | 0.0 /100 | #317 | Tragic 88.9% |
| Nicaraguans | 0.0 /100 | #318 | Tragic 88.9% |
| Belizeans | 0.0 /100 | #319 | Tragic 88.8% |
| Immigrants | Armenia | 0.0 /100 | #320 | Tragic 88.8% |
| Immigrants | Belize | 0.0 /100 | #321 | Tragic 88.7% |
| Puerto Ricans | 0.0 /100 | #322 | Tragic 88.4% |