Immigrants from Guyana vs Chickasaw 2nd Grade
COMPARE
Immigrants from Guyana
Chickasaw
2nd Grade
2nd Grade Comparison
Immigrants from Guyana
Chickasaw
96.7%
2ND GRADE
0.0/ 100
METRIC RATING
320th/ 347
METRIC RANK
98.3%
2ND GRADE
99.6/ 100
METRIC RATING
71st/ 347
METRIC RANK
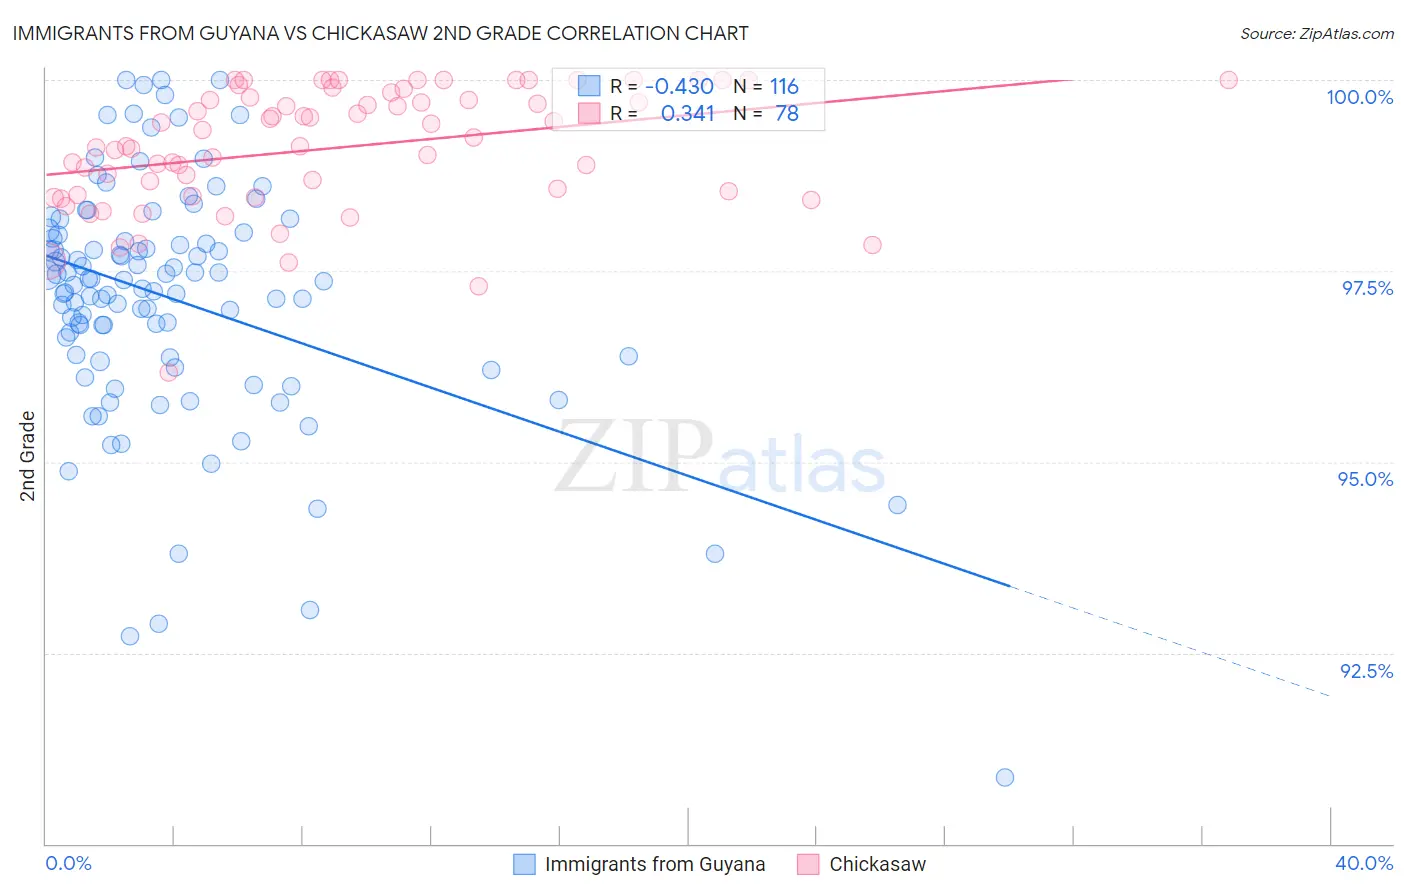
Immigrants from Guyana vs Chickasaw 2nd Grade Correlation Chart
The statistical analysis conducted on geographies consisting of 183,746,342 people shows a moderate negative correlation between the proportion of Immigrants from Guyana and percentage of population with at least 2nd grade education in the United States with a correlation coefficient (R) of -0.430 and weighted average of 96.7%. Similarly, the statistical analysis conducted on geographies consisting of 147,725,311 people shows a mild positive correlation between the proportion of Chickasaw and percentage of population with at least 2nd grade education in the United States with a correlation coefficient (R) of 0.341 and weighted average of 98.3%, a difference of 1.6%.
2nd Grade Correlation Summary
| Measurement | Immigrants from Guyana | Chickasaw |
| Minimum | 90.9% | 96.2% |
| Maximum | 100.0% | 100.0% |
| Range | 9.1% | 3.8% |
| Mean | 97.1% | 99.1% |
| Median | 97.3% | 99.2% |
| Interquartile 25% (IQ1) | 96.4% | 98.5% |
| Interquartile 75% (IQ3) | 98.0% | 99.8% |
| Interquartile Range (IQR) | 1.6% | 1.3% |
| Standard Deviation (Sample) | 1.6% | 0.81% |
| Standard Deviation (Population) | 1.6% | 0.80% |
Similar Demographics by 2nd Grade
Demographics Similar to Immigrants from Guyana by 2nd Grade
In terms of 2nd grade, the demographic groups most similar to Immigrants from Guyana are Immigrants from Burma/Myanmar (96.7%, a difference of 0.0%), Honduran (96.7%, a difference of 0.010%), Immigrants from Laos (96.7%, a difference of 0.010%), Indonesian (96.7%, a difference of 0.010%), and Immigrants from Nicaragua (96.7%, a difference of 0.010%).
| Demographics | Rating | Rank | 2nd Grade |
| Hispanics or Latinos | 0.0 /100 | #313 | Tragic 96.8% |
| Immigrants | Ecuador | 0.0 /100 | #314 | Tragic 96.8% |
| Immigrants | Belize | 0.0 /100 | #315 | Tragic 96.8% |
| Hondurans | 0.0 /100 | #316 | Tragic 96.7% |
| Immigrants | Laos | 0.0 /100 | #317 | Tragic 96.7% |
| Indonesians | 0.0 /100 | #318 | Tragic 96.7% |
| Immigrants | Nicaragua | 0.0 /100 | #319 | Tragic 96.7% |
| Immigrants | Guyana | 0.0 /100 | #320 | Tragic 96.7% |
| Immigrants | Burma/Myanmar | 0.0 /100 | #321 | Tragic 96.7% |
| Immigrants | Bangladesh | 0.0 /100 | #322 | Tragic 96.7% |
| Vietnamese | 0.0 /100 | #323 | Tragic 96.7% |
| Mexican American Indians | 0.0 /100 | #324 | Tragic 96.7% |
| Dominicans | 0.0 /100 | #325 | Tragic 96.6% |
| Immigrants | Honduras | 0.0 /100 | #326 | Tragic 96.6% |
| Immigrants | Vietnam | 0.0 /100 | #327 | Tragic 96.5% |
Demographics Similar to Chickasaw by 2nd Grade
In terms of 2nd grade, the demographic groups most similar to Chickasaw are Immigrants from Austria (98.3%, a difference of 0.0%), Serbian (98.3%, a difference of 0.0%), Canadian (98.3%, a difference of 0.010%), Immigrants from Northern Europe (98.3%, a difference of 0.010%), and Russian (98.3%, a difference of 0.010%).
| Demographics | Rating | Rank | 2nd Grade |
| Immigrants | North America | 99.7 /100 | #64 | Exceptional 98.3% |
| New Zealanders | 99.7 /100 | #65 | Exceptional 98.3% |
| Canadians | 99.7 /100 | #66 | Exceptional 98.3% |
| Immigrants | Northern Europe | 99.7 /100 | #67 | Exceptional 98.3% |
| Russians | 99.7 /100 | #68 | Exceptional 98.3% |
| Immigrants | Austria | 99.6 /100 | #69 | Exceptional 98.3% |
| Serbians | 99.6 /100 | #70 | Exceptional 98.3% |
| Chickasaw | 99.6 /100 | #71 | Exceptional 98.3% |
| Cheyenne | 99.6 /100 | #72 | Exceptional 98.3% |
| Cajuns | 99.5 /100 | #73 | Exceptional 98.3% |
| Immigrants | Netherlands | 99.4 /100 | #74 | Exceptional 98.3% |
| Shoshone | 99.4 /100 | #75 | Exceptional 98.3% |
| Cherokee | 99.4 /100 | #76 | Exceptional 98.3% |
| Immigrants | England | 99.4 /100 | #77 | Exceptional 98.3% |
| Immigrants | Lithuania | 99.3 /100 | #78 | Exceptional 98.2% |