Immigrants from Guyana vs Barbadian 2nd Grade
COMPARE
Immigrants from Guyana
Barbadian
2nd Grade
2nd Grade Comparison
Immigrants from Guyana
Barbadians
96.7%
2ND GRADE
0.0/ 100
METRIC RATING
320th/ 347
METRIC RANK
97.3%
2ND GRADE
0.1/ 100
METRIC RATING
282nd/ 347
METRIC RANK
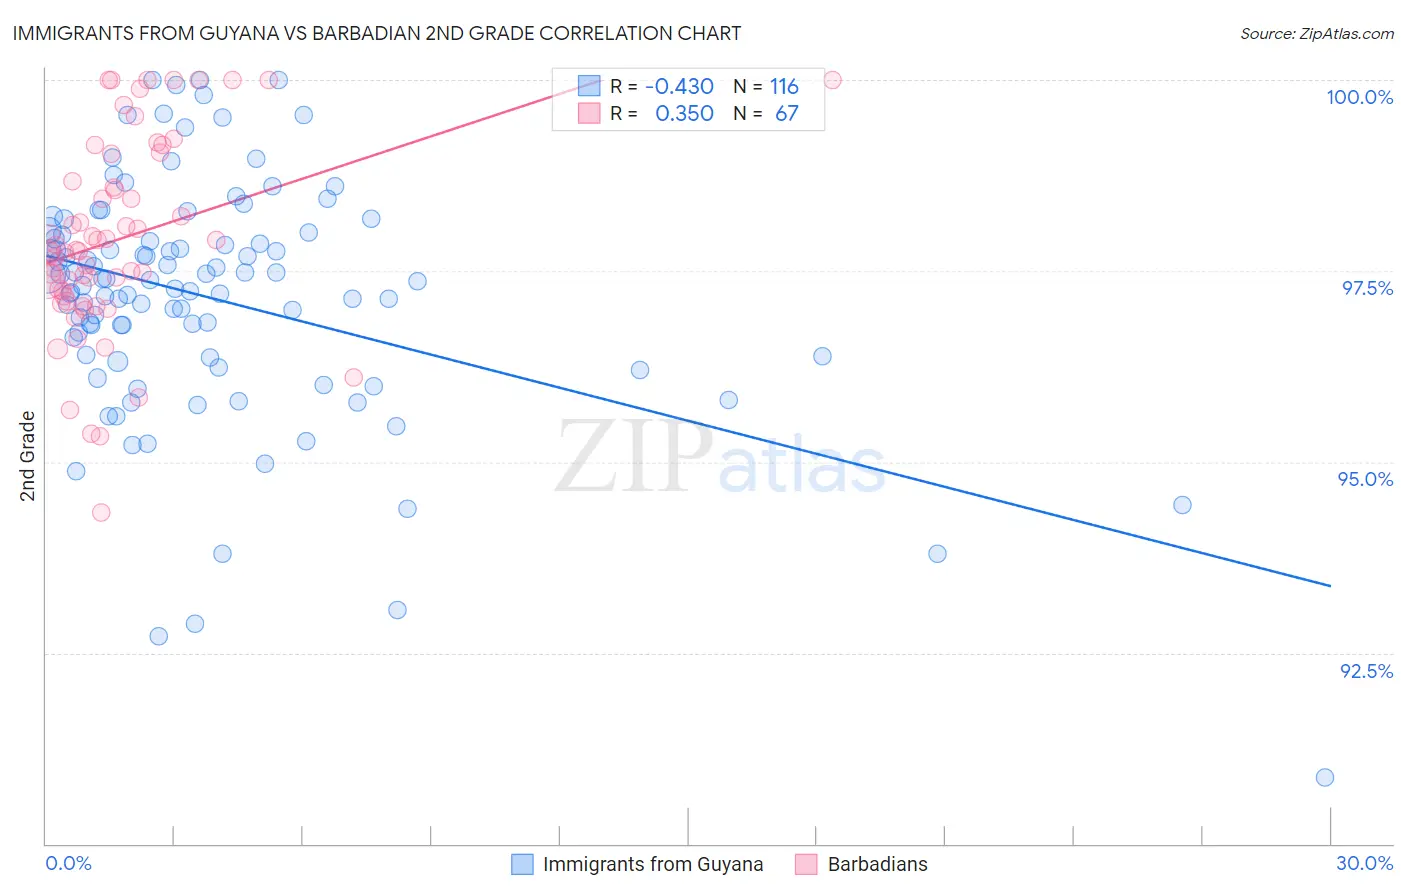
Immigrants from Guyana vs Barbadian 2nd Grade Correlation Chart
The statistical analysis conducted on geographies consisting of 183,746,342 people shows a moderate negative correlation between the proportion of Immigrants from Guyana and percentage of population with at least 2nd grade education in the United States with a correlation coefficient (R) of -0.430 and weighted average of 96.7%. Similarly, the statistical analysis conducted on geographies consisting of 141,304,590 people shows a mild positive correlation between the proportion of Barbadians and percentage of population with at least 2nd grade education in the United States with a correlation coefficient (R) of 0.350 and weighted average of 97.3%, a difference of 0.57%.
2nd Grade Correlation Summary
| Measurement | Immigrants from Guyana | Barbadian |
| Minimum | 90.9% | 94.3% |
| Maximum | 100.0% | 100.0% |
| Range | 9.1% | 5.7% |
| Mean | 97.1% | 97.9% |
| Median | 97.3% | 97.8% |
| Interquartile 25% (IQ1) | 96.4% | 97.2% |
| Interquartile 75% (IQ3) | 98.0% | 99.0% |
| Interquartile Range (IQR) | 1.6% | 1.9% |
| Standard Deviation (Sample) | 1.6% | 1.3% |
| Standard Deviation (Population) | 1.6% | 1.3% |
Similar Demographics by 2nd Grade
Demographics Similar to Immigrants from Guyana by 2nd Grade
In terms of 2nd grade, the demographic groups most similar to Immigrants from Guyana are Immigrants from Burma/Myanmar (96.7%, a difference of 0.0%), Honduran (96.7%, a difference of 0.010%), Immigrants from Laos (96.7%, a difference of 0.010%), Indonesian (96.7%, a difference of 0.010%), and Immigrants from Nicaragua (96.7%, a difference of 0.010%).
| Demographics | Rating | Rank | 2nd Grade |
| Hispanics or Latinos | 0.0 /100 | #313 | Tragic 96.8% |
| Immigrants | Ecuador | 0.0 /100 | #314 | Tragic 96.8% |
| Immigrants | Belize | 0.0 /100 | #315 | Tragic 96.8% |
| Hondurans | 0.0 /100 | #316 | Tragic 96.7% |
| Immigrants | Laos | 0.0 /100 | #317 | Tragic 96.7% |
| Indonesians | 0.0 /100 | #318 | Tragic 96.7% |
| Immigrants | Nicaragua | 0.0 /100 | #319 | Tragic 96.7% |
| Immigrants | Guyana | 0.0 /100 | #320 | Tragic 96.7% |
| Immigrants | Burma/Myanmar | 0.0 /100 | #321 | Tragic 96.7% |
| Immigrants | Bangladesh | 0.0 /100 | #322 | Tragic 96.7% |
| Vietnamese | 0.0 /100 | #323 | Tragic 96.7% |
| Mexican American Indians | 0.0 /100 | #324 | Tragic 96.7% |
| Dominicans | 0.0 /100 | #325 | Tragic 96.6% |
| Immigrants | Honduras | 0.0 /100 | #326 | Tragic 96.6% |
| Immigrants | Vietnam | 0.0 /100 | #327 | Tragic 96.5% |
Demographics Similar to Barbadians by 2nd Grade
In terms of 2nd grade, the demographic groups most similar to Barbadians are Immigrants from Ghana (97.3%, a difference of 0.010%), Afghan (97.3%, a difference of 0.010%), Trinidadian and Tobagonian (97.3%, a difference of 0.010%), Immigrants from Western Africa (97.3%, a difference of 0.030%), and Immigrants from Uzbekistan (97.3%, a difference of 0.030%).
| Demographics | Rating | Rank | 2nd Grade |
| Immigrants | China | 0.1 /100 | #275 | Tragic 97.3% |
| Immigrants | Philippines | 0.1 /100 | #276 | Tragic 97.3% |
| Immigrants | Western Africa | 0.1 /100 | #277 | Tragic 97.3% |
| Immigrants | Uzbekistan | 0.1 /100 | #278 | Tragic 97.3% |
| Immigrants | Ghana | 0.1 /100 | #279 | Tragic 97.3% |
| Afghans | 0.1 /100 | #280 | Tragic 97.3% |
| Trinidadians and Tobagonians | 0.1 /100 | #281 | Tragic 97.3% |
| Barbadians | 0.1 /100 | #282 | Tragic 97.3% |
| Immigrants | Trinidad and Tobago | 0.0 /100 | #283 | Tragic 97.2% |
| Immigrants | West Indies | 0.0 /100 | #284 | Tragic 97.2% |
| Immigrants | Hong Kong | 0.0 /100 | #285 | Tragic 97.2% |
| Immigrants | Barbados | 0.0 /100 | #286 | Tragic 97.2% |
| Immigrants | Portugal | 0.0 /100 | #287 | Tragic 97.2% |
| Immigrants | Thailand | 0.0 /100 | #288 | Tragic 97.2% |
| Houma | 0.0 /100 | #289 | Tragic 97.2% |