Indonesian vs Chickasaw 2nd Grade
COMPARE
Indonesian
Chickasaw
2nd Grade
2nd Grade Comparison
Indonesians
Chickasaw
96.7%
2ND GRADE
0.0/ 100
METRIC RATING
318th/ 347
METRIC RANK
98.3%
2ND GRADE
99.6/ 100
METRIC RATING
71st/ 347
METRIC RANK
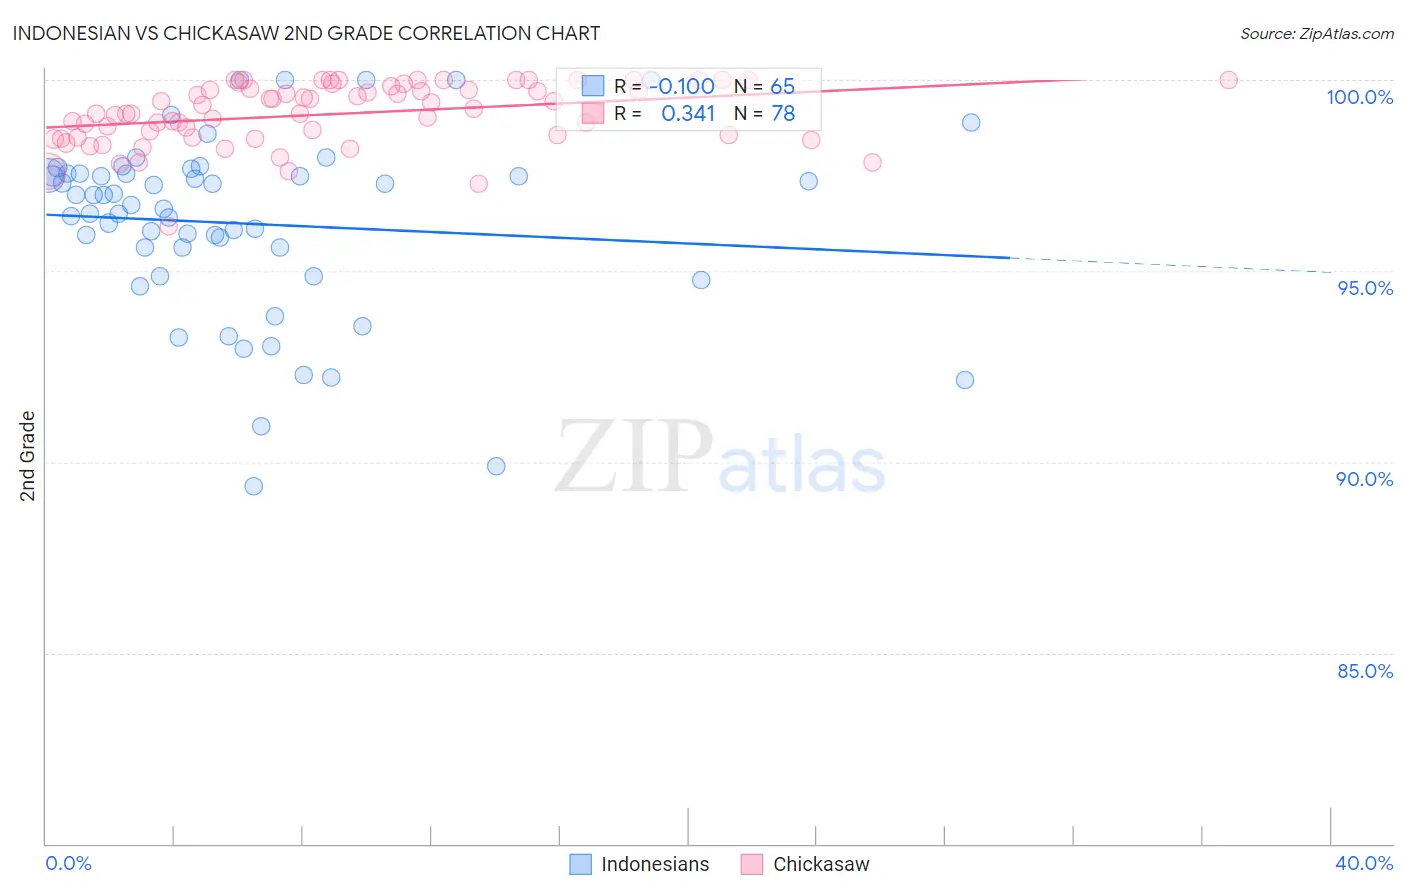
Indonesian vs Chickasaw 2nd Grade Correlation Chart
The statistical analysis conducted on geographies consisting of 162,707,412 people shows a poor negative correlation between the proportion of Indonesians and percentage of population with at least 2nd grade education in the United States with a correlation coefficient (R) of -0.100 and weighted average of 96.7%. Similarly, the statistical analysis conducted on geographies consisting of 147,725,311 people shows a mild positive correlation between the proportion of Chickasaw and percentage of population with at least 2nd grade education in the United States with a correlation coefficient (R) of 0.341 and weighted average of 98.3%, a difference of 1.6%.
2nd Grade Correlation Summary
| Measurement | Indonesian | Chickasaw |
| Minimum | 89.4% | 96.2% |
| Maximum | 100.0% | 100.0% |
| Range | 10.6% | 3.8% |
| Mean | 96.2% | 99.1% |
| Median | 96.7% | 99.2% |
| Interquartile 25% (IQ1) | 95.2% | 98.5% |
| Interquartile 75% (IQ3) | 97.5% | 99.8% |
| Interquartile Range (IQR) | 2.3% | 1.3% |
| Standard Deviation (Sample) | 2.4% | 0.81% |
| Standard Deviation (Population) | 2.3% | 0.80% |
Similar Demographics by 2nd Grade
Demographics Similar to Indonesians by 2nd Grade
In terms of 2nd grade, the demographic groups most similar to Indonesians are Honduran (96.7%, a difference of 0.0%), Immigrants from Laos (96.7%, a difference of 0.0%), Immigrants from Nicaragua (96.7%, a difference of 0.0%), Immigrants from Belize (96.8%, a difference of 0.010%), and Immigrants from Guyana (96.7%, a difference of 0.010%).
| Demographics | Rating | Rank | 2nd Grade |
| Guyanese | 0.0 /100 | #311 | Tragic 96.8% |
| Cape Verdeans | 0.0 /100 | #312 | Tragic 96.8% |
| Hispanics or Latinos | 0.0 /100 | #313 | Tragic 96.8% |
| Immigrants | Ecuador | 0.0 /100 | #314 | Tragic 96.8% |
| Immigrants | Belize | 0.0 /100 | #315 | Tragic 96.8% |
| Hondurans | 0.0 /100 | #316 | Tragic 96.7% |
| Immigrants | Laos | 0.0 /100 | #317 | Tragic 96.7% |
| Indonesians | 0.0 /100 | #318 | Tragic 96.7% |
| Immigrants | Nicaragua | 0.0 /100 | #319 | Tragic 96.7% |
| Immigrants | Guyana | 0.0 /100 | #320 | Tragic 96.7% |
| Immigrants | Burma/Myanmar | 0.0 /100 | #321 | Tragic 96.7% |
| Immigrants | Bangladesh | 0.0 /100 | #322 | Tragic 96.7% |
| Vietnamese | 0.0 /100 | #323 | Tragic 96.7% |
| Mexican American Indians | 0.0 /100 | #324 | Tragic 96.7% |
| Dominicans | 0.0 /100 | #325 | Tragic 96.6% |
Demographics Similar to Chickasaw by 2nd Grade
In terms of 2nd grade, the demographic groups most similar to Chickasaw are Immigrants from Austria (98.3%, a difference of 0.0%), Serbian (98.3%, a difference of 0.0%), Canadian (98.3%, a difference of 0.010%), Immigrants from Northern Europe (98.3%, a difference of 0.010%), and Russian (98.3%, a difference of 0.010%).
| Demographics | Rating | Rank | 2nd Grade |
| Immigrants | North America | 99.7 /100 | #64 | Exceptional 98.3% |
| New Zealanders | 99.7 /100 | #65 | Exceptional 98.3% |
| Canadians | 99.7 /100 | #66 | Exceptional 98.3% |
| Immigrants | Northern Europe | 99.7 /100 | #67 | Exceptional 98.3% |
| Russians | 99.7 /100 | #68 | Exceptional 98.3% |
| Immigrants | Austria | 99.6 /100 | #69 | Exceptional 98.3% |
| Serbians | 99.6 /100 | #70 | Exceptional 98.3% |
| Chickasaw | 99.6 /100 | #71 | Exceptional 98.3% |
| Cheyenne | 99.6 /100 | #72 | Exceptional 98.3% |
| Cajuns | 99.5 /100 | #73 | Exceptional 98.3% |
| Immigrants | Netherlands | 99.4 /100 | #74 | Exceptional 98.3% |
| Shoshone | 99.4 /100 | #75 | Exceptional 98.3% |
| Cherokee | 99.4 /100 | #76 | Exceptional 98.3% |
| Immigrants | England | 99.4 /100 | #77 | Exceptional 98.3% |
| Immigrants | Lithuania | 99.3 /100 | #78 | Exceptional 98.2% |