Immigrants from Guatemala vs Syrian 7th Grade
COMPARE
Immigrants from Guatemala
Syrian
7th Grade
7th Grade Comparison
Immigrants from Guatemala
Syrians
91.3%
7TH GRADE
0.0/ 100
METRIC RATING
343rd/ 347
METRIC RANK
96.5%
7TH GRADE
96.6/ 100
METRIC RATING
116th/ 347
METRIC RANK
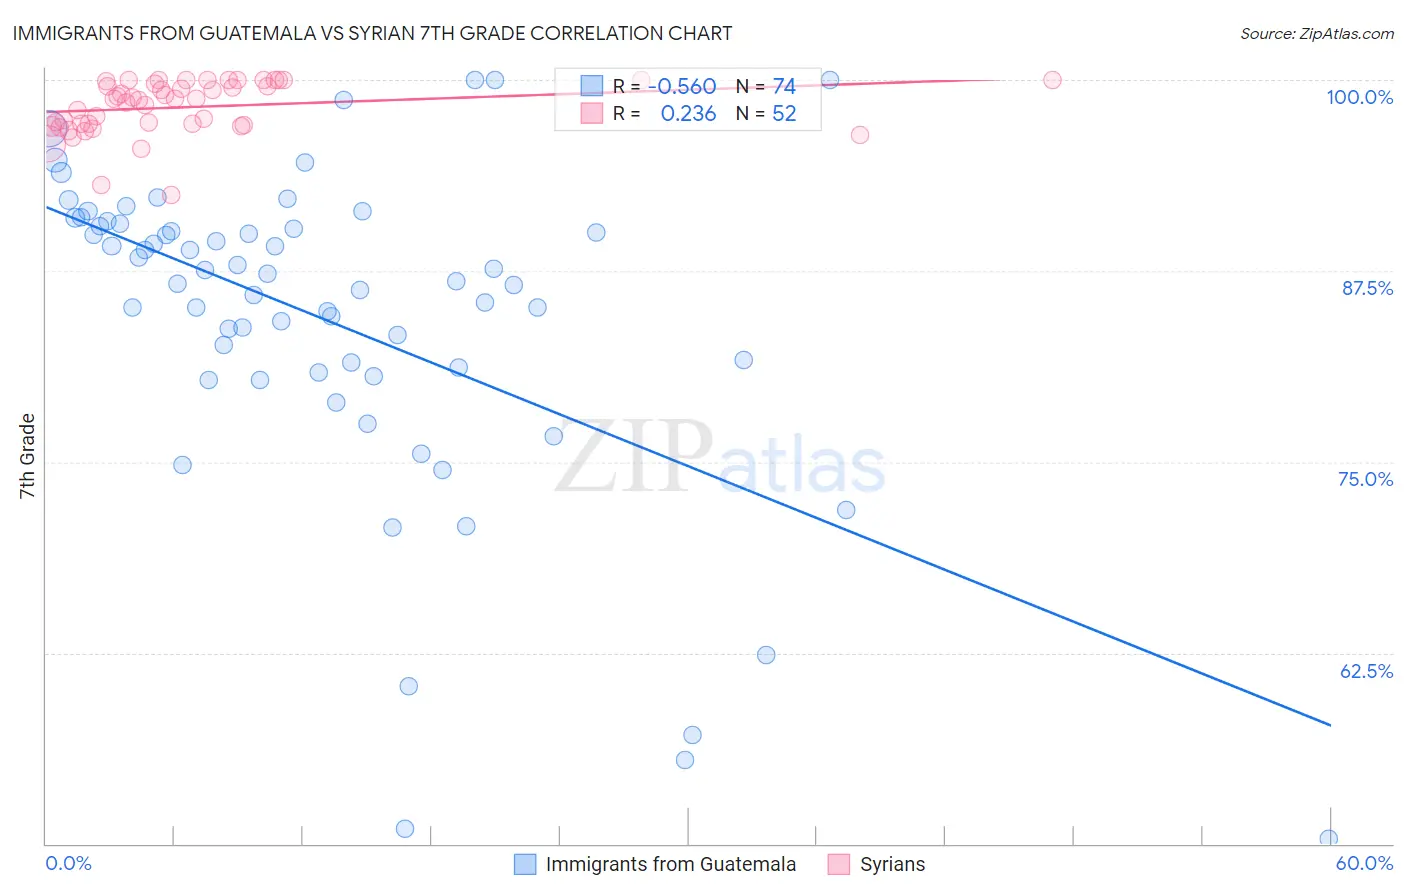
Immigrants from Guatemala vs Syrian 7th Grade Correlation Chart
The statistical analysis conducted on geographies consisting of 377,286,142 people shows a substantial negative correlation between the proportion of Immigrants from Guatemala and percentage of population with at least 7th grade education in the United States with a correlation coefficient (R) of -0.560 and weighted average of 91.3%. Similarly, the statistical analysis conducted on geographies consisting of 266,305,988 people shows a weak positive correlation between the proportion of Syrians and percentage of population with at least 7th grade education in the United States with a correlation coefficient (R) of 0.236 and weighted average of 96.5%, a difference of 5.7%.
7th Grade Correlation Summary
| Measurement | Immigrants from Guatemala | Syrian |
| Minimum | 50.3% | 92.5% |
| Maximum | 100.0% | 100.0% |
| Range | 49.7% | 7.5% |
| Mean | 84.2% | 98.2% |
| Median | 86.7% | 98.8% |
| Interquartile 25% (IQ1) | 80.8% | 97.1% |
| Interquartile 75% (IQ3) | 90.5% | 99.8% |
| Interquartile Range (IQR) | 9.6% | 2.7% |
| Standard Deviation (Sample) | 10.7% | 1.7% |
| Standard Deviation (Population) | 10.6% | 1.7% |
Similar Demographics by 7th Grade
Demographics Similar to Immigrants from Guatemala by 7th Grade
In terms of 7th grade, the demographic groups most similar to Immigrants from Guatemala are Salvadoran (91.5%, a difference of 0.16%), Immigrants from Central America (91.0%, a difference of 0.36%), Guatemalan (91.7%, a difference of 0.43%), Immigrants from El Salvador (90.9%, a difference of 0.43%), and Yakama (91.7%, a difference of 0.45%).
| Demographics | Rating | Rank | 7th Grade |
| Immigrants | Armenia | 0.0 /100 | #333 | Tragic 92.7% |
| Immigrants | Yemen | 0.0 /100 | #334 | Tragic 92.6% |
| Mexican American Indians | 0.0 /100 | #335 | Tragic 92.6% |
| Immigrants | Honduras | 0.0 /100 | #336 | Tragic 92.5% |
| Immigrants | Latin America | 0.0 /100 | #337 | Tragic 92.2% |
| Central Americans | 0.0 /100 | #338 | Tragic 92.1% |
| Mexicans | 0.0 /100 | #339 | Tragic 91.9% |
| Yakama | 0.0 /100 | #340 | Tragic 91.7% |
| Guatemalans | 0.0 /100 | #341 | Tragic 91.7% |
| Salvadorans | 0.0 /100 | #342 | Tragic 91.5% |
| Immigrants | Guatemala | 0.0 /100 | #343 | Tragic 91.3% |
| Immigrants | Central America | 0.0 /100 | #344 | Tragic 91.0% |
| Immigrants | El Salvador | 0.0 /100 | #345 | Tragic 90.9% |
| Immigrants | Mexico | 0.0 /100 | #346 | Tragic 90.7% |
| Spanish American Indians | 0.0 /100 | #347 | Tragic 90.3% |
Demographics Similar to Syrians by 7th Grade
In terms of 7th grade, the demographic groups most similar to Syrians are Immigrants from Zimbabwe (96.5%, a difference of 0.0%), Choctaw (96.5%, a difference of 0.0%), Pueblo (96.5%, a difference of 0.010%), Nonimmigrants (96.5%, a difference of 0.020%), and Okinawan (96.6%, a difference of 0.040%).
| Demographics | Rating | Rank | 7th Grade |
| Bhutanese | 97.7 /100 | #109 | Exceptional 96.6% |
| Okinawans | 97.4 /100 | #110 | Exceptional 96.6% |
| Immigrants | Latvia | 97.4 /100 | #111 | Exceptional 96.6% |
| Immigrants | Nonimmigrants | 97.0 /100 | #112 | Exceptional 96.5% |
| Pueblo | 96.8 /100 | #113 | Exceptional 96.5% |
| Immigrants | Zimbabwe | 96.6 /100 | #114 | Exceptional 96.5% |
| Choctaw | 96.6 /100 | #115 | Exceptional 96.5% |
| Syrians | 96.6 /100 | #116 | Exceptional 96.5% |
| Immigrants | Moldova | 95.7 /100 | #117 | Exceptional 96.5% |
| Immigrants | Japan | 95.5 /100 | #118 | Exceptional 96.5% |
| Immigrants | Norway | 95.2 /100 | #119 | Exceptional 96.5% |
| Immigrants | Croatia | 95.0 /100 | #120 | Exceptional 96.5% |
| Cheyenne | 94.9 /100 | #121 | Exceptional 96.5% |
| Immigrants | Europe | 94.8 /100 | #122 | Exceptional 96.5% |
| Immigrants | France | 94.7 /100 | #123 | Exceptional 96.5% |