Immigrants from Guatemala vs Honduran Nursery School
COMPARE
Immigrants from Guatemala
Honduran
Nursery School
Nursery School Comparison
Immigrants from Guatemala
Hondurans
96.4%
NURSERY SCHOOL
0.0/ 100
METRIC RATING
339th/ 347
METRIC RANK
97.0%
NURSERY SCHOOL
0.0/ 100
METRIC RATING
313th/ 347
METRIC RANK
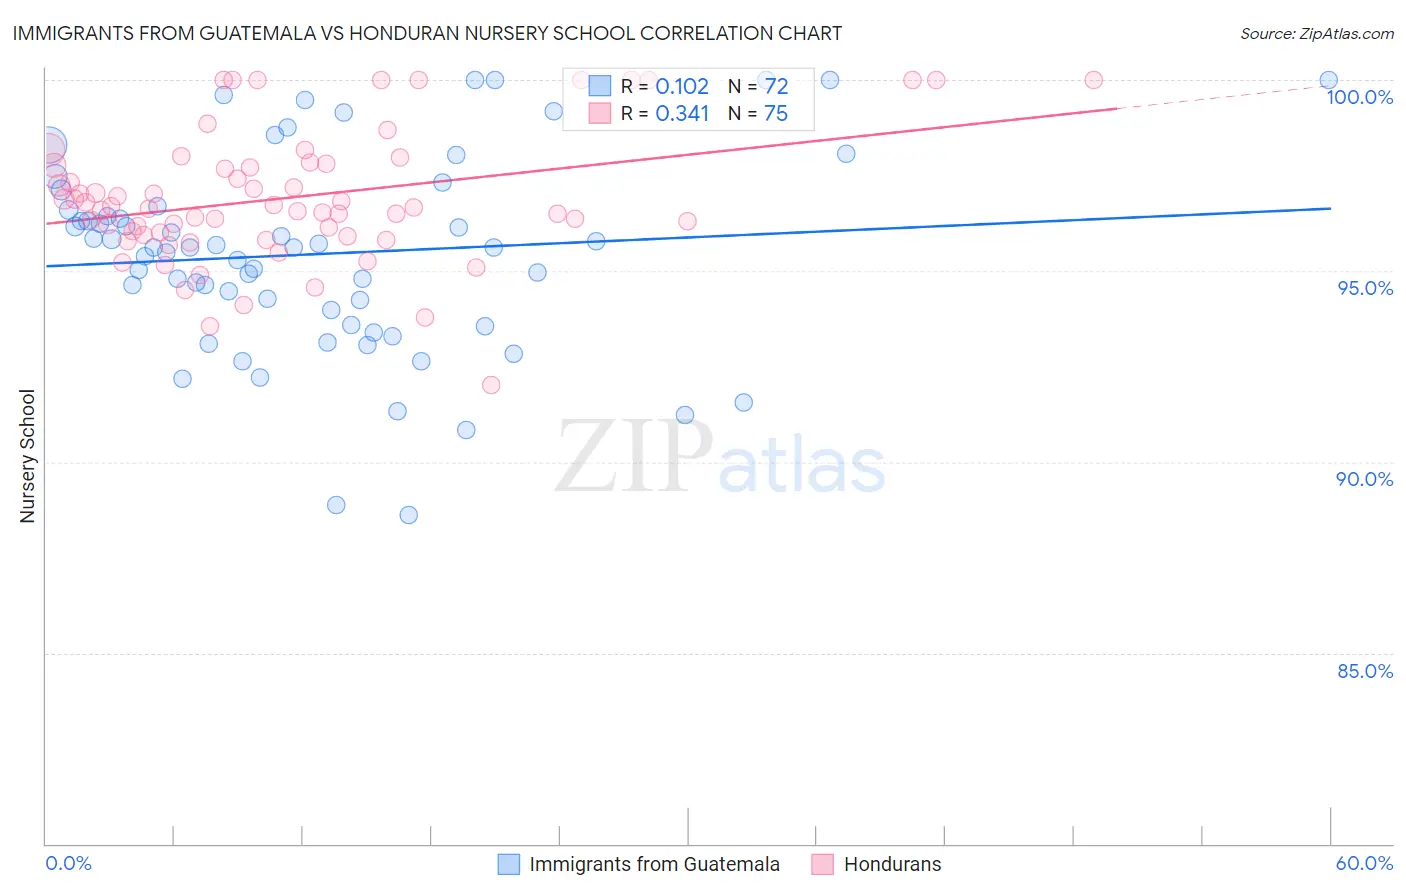
Immigrants from Guatemala vs Honduran Nursery School Correlation Chart
The statistical analysis conducted on geographies consisting of 377,282,938 people shows a poor positive correlation between the proportion of Immigrants from Guatemala and percentage of population with at least nursery school education in the United States with a correlation coefficient (R) of 0.102 and weighted average of 96.4%. Similarly, the statistical analysis conducted on geographies consisting of 357,783,041 people shows a mild positive correlation between the proportion of Hondurans and percentage of population with at least nursery school education in the United States with a correlation coefficient (R) of 0.341 and weighted average of 97.0%, a difference of 0.53%.
Nursery School Correlation Summary
| Measurement | Immigrants from Guatemala | Honduran |
| Minimum | 88.6% | 92.0% |
| Maximum | 100.0% | 100.0% |
| Range | 11.4% | 8.0% |
| Mean | 95.4% | 96.9% |
| Median | 95.6% | 96.6% |
| Interquartile 25% (IQ1) | 93.8% | 95.9% |
| Interquartile 75% (IQ3) | 96.7% | 97.8% |
| Interquartile Range (IQR) | 2.9% | 1.9% |
| Standard Deviation (Sample) | 2.6% | 1.7% |
| Standard Deviation (Population) | 2.6% | 1.7% |
Similar Demographics by Nursery School
Demographics Similar to Immigrants from Guatemala by Nursery School
In terms of nursery school, the demographic groups most similar to Immigrants from Guatemala are Immigrants from Central America (96.4%, a difference of 0.030%), Immigrants from Cabo Verde (96.4%, a difference of 0.060%), Immigrants from Mexico (96.4%, a difference of 0.060%), Immigrants from Cambodia (96.5%, a difference of 0.080%), and Immigrants from Fiji (96.5%, a difference of 0.080%).
| Demographics | Rating | Rank | Nursery School |
| Yakama | 0.0 /100 | #332 | Tragic 96.6% |
| Central Americans | 0.0 /100 | #333 | Tragic 96.6% |
| Immigrants | Dominican Republic | 0.0 /100 | #334 | Tragic 96.6% |
| Bangladeshis | 0.0 /100 | #335 | Tragic 96.6% |
| Guatemalans | 0.0 /100 | #336 | Tragic 96.6% |
| Immigrants | Cambodia | 0.0 /100 | #337 | Tragic 96.5% |
| Immigrants | Fiji | 0.0 /100 | #338 | Tragic 96.5% |
| Immigrants | Guatemala | 0.0 /100 | #339 | Tragic 96.4% |
| Immigrants | Central America | 0.0 /100 | #340 | Tragic 96.4% |
| Immigrants | Cabo Verde | 0.0 /100 | #341 | Tragic 96.4% |
| Immigrants | Mexico | 0.0 /100 | #342 | Tragic 96.4% |
| Salvadorans | 0.0 /100 | #343 | Tragic 96.4% |
| Immigrants | El Salvador | 0.0 /100 | #344 | Tragic 96.2% |
| Nepalese | 0.0 /100 | #345 | Tragic 96.2% |
| Immigrants | Yemen | 0.0 /100 | #346 | Tragic 95.9% |
Demographics Similar to Hondurans by Nursery School
In terms of nursery school, the demographic groups most similar to Hondurans are Cape Verdean (97.0%, a difference of 0.010%), Immigrants from Nicaragua (96.9%, a difference of 0.010%), Immigrants from Belize (96.9%, a difference of 0.010%), Sri Lankan (97.0%, a difference of 0.020%), and Immigrants from Ecuador (96.9%, a difference of 0.020%).
| Demographics | Rating | Rank | Nursery School |
| Belizeans | 0.0 /100 | #306 | Tragic 97.0% |
| Hispanics or Latinos | 0.0 /100 | #307 | Tragic 97.0% |
| Immigrants | Haiti | 0.0 /100 | #308 | Tragic 97.0% |
| Immigrants | Somalia | 0.0 /100 | #309 | Tragic 97.0% |
| Guyanese | 0.0 /100 | #310 | Tragic 97.0% |
| Immigrants | Azores | 0.0 /100 | #311 | Tragic 97.0% |
| Sri Lankans | 0.0 /100 | #312 | Tragic 97.0% |
| Hondurans | 0.0 /100 | #313 | Tragic 97.0% |
| Cape Verdeans | 0.0 /100 | #314 | Tragic 97.0% |
| Immigrants | Nicaragua | 0.0 /100 | #315 | Tragic 96.9% |
| Immigrants | Belize | 0.0 /100 | #316 | Tragic 96.9% |
| Immigrants | Ecuador | 0.0 /100 | #317 | Tragic 96.9% |
| Immigrants | Guyana | 0.0 /100 | #318 | Tragic 96.9% |
| Immigrants | Laos | 0.0 /100 | #319 | Tragic 96.9% |
| Immigrants | Burma/Myanmar | 0.0 /100 | #320 | Tragic 96.9% |