Immigrants from Guatemala vs Immigrants from Uzbekistan 9th Grade
COMPARE
Immigrants from Guatemala
Immigrants from Uzbekistan
9th Grade
9th Grade Comparison
Immigrants from Guatemala
Immigrants from Uzbekistan
89.4%
9TH GRADE
0.0/ 100
METRIC RATING
343rd/ 347
METRIC RANK
93.9%
9TH GRADE
0.4/ 100
METRIC RATING
263rd/ 347
METRIC RANK
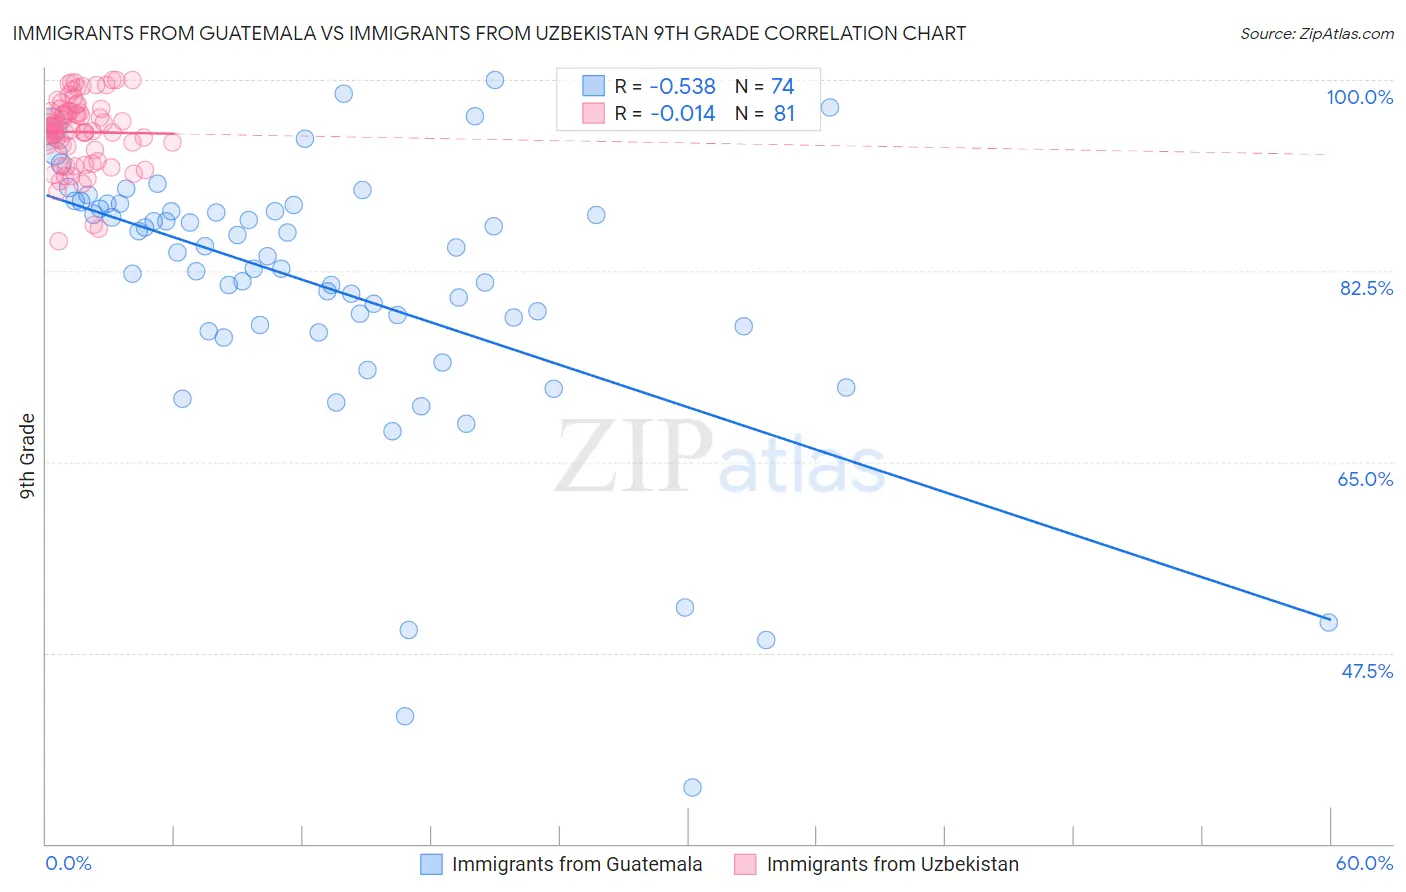
Immigrants from Guatemala vs Immigrants from Uzbekistan 9th Grade Correlation Chart
The statistical analysis conducted on geographies consisting of 377,286,142 people shows a substantial negative correlation between the proportion of Immigrants from Guatemala and percentage of population with at least 9th grade education in the United States with a correlation coefficient (R) of -0.538 and weighted average of 89.4%. Similarly, the statistical analysis conducted on geographies consisting of 118,593,934 people shows no correlation between the proportion of Immigrants from Uzbekistan and percentage of population with at least 9th grade education in the United States with a correlation coefficient (R) of -0.014 and weighted average of 93.9%, a difference of 5.0%.
9th Grade Correlation Summary
| Measurement | Immigrants from Guatemala | Immigrants from Uzbekistan |
| Minimum | 35.2% | 85.2% |
| Maximum | 100.0% | 100.0% |
| Range | 64.8% | 14.8% |
| Mean | 80.9% | 95.2% |
| Median | 84.1% | 95.5% |
| Interquartile 25% (IQ1) | 77.5% | 93.7% |
| Interquartile 75% (IQ3) | 88.2% | 97.1% |
| Interquartile Range (IQR) | 10.7% | 3.4% |
| Standard Deviation (Sample) | 12.7% | 3.2% |
| Standard Deviation (Population) | 12.6% | 3.2% |
Similar Demographics by 9th Grade
Demographics Similar to Immigrants from Guatemala by 9th Grade
In terms of 9th grade, the demographic groups most similar to Immigrants from Guatemala are Salvadoran (89.6%, a difference of 0.20%), Guatemalan (89.9%, a difference of 0.51%), Immigrants from El Salvador (89.0%, a difference of 0.51%), Immigrants from Central America (89.0%, a difference of 0.53%), and Mexican (90.0%, a difference of 0.63%).
| Demographics | Rating | Rank | 9th Grade |
| Immigrants | Yemen | 0.0 /100 | #333 | Tragic 90.8% |
| Immigrants | Azores | 0.0 /100 | #334 | Tragic 90.8% |
| Immigrants | Honduras | 0.0 /100 | #335 | Tragic 90.6% |
| Immigrants | Dominican Republic | 0.0 /100 | #336 | Tragic 90.5% |
| Immigrants | Latin America | 0.0 /100 | #337 | Tragic 90.4% |
| Central Americans | 0.0 /100 | #338 | Tragic 90.4% |
| Yakama | 0.0 /100 | #339 | Tragic 90.1% |
| Mexicans | 0.0 /100 | #340 | Tragic 90.0% |
| Guatemalans | 0.0 /100 | #341 | Tragic 89.9% |
| Salvadorans | 0.0 /100 | #342 | Tragic 89.6% |
| Immigrants | Guatemala | 0.0 /100 | #343 | Tragic 89.4% |
| Immigrants | El Salvador | 0.0 /100 | #344 | Tragic 89.0% |
| Immigrants | Central America | 0.0 /100 | #345 | Tragic 89.0% |
| Immigrants | Mexico | 0.0 /100 | #346 | Tragic 88.7% |
| Spanish American Indians | 0.0 /100 | #347 | Tragic 88.3% |
Demographics Similar to Immigrants from Uzbekistan by 9th Grade
In terms of 9th grade, the demographic groups most similar to Immigrants from Uzbekistan are Immigrants from Congo (93.9%, a difference of 0.0%), Immigrants from Jamaica (93.9%, a difference of 0.010%), Native/Alaskan (93.9%, a difference of 0.010%), South American (93.9%, a difference of 0.020%), and Navajo (93.9%, a difference of 0.020%).
| Demographics | Rating | Rank | 9th Grade |
| Immigrants | Afghanistan | 0.5 /100 | #256 | Tragic 94.0% |
| Immigrants | Costa Rica | 0.5 /100 | #257 | Tragic 94.0% |
| Immigrants | Thailand | 0.5 /100 | #258 | Tragic 93.9% |
| Ghanaians | 0.5 /100 | #259 | Tragic 93.9% |
| Pima | 0.4 /100 | #260 | Tragic 93.9% |
| South Americans | 0.4 /100 | #261 | Tragic 93.9% |
| Immigrants | Jamaica | 0.4 /100 | #262 | Tragic 93.9% |
| Immigrants | Uzbekistan | 0.4 /100 | #263 | Tragic 93.9% |
| Immigrants | Congo | 0.4 /100 | #264 | Tragic 93.9% |
| Natives/Alaskans | 0.4 /100 | #265 | Tragic 93.9% |
| Navajo | 0.3 /100 | #266 | Tragic 93.9% |
| Armenians | 0.3 /100 | #267 | Tragic 93.9% |
| Immigrants | Bolivia | 0.3 /100 | #268 | Tragic 93.9% |
| Immigrants | Uruguay | 0.2 /100 | #269 | Tragic 93.8% |
| Yuman | 0.2 /100 | #270 | Tragic 93.8% |