Immigrants from Grenada vs Sioux 7th Grade
COMPARE
Immigrants from Grenada
Sioux
7th Grade
7th Grade Comparison
Immigrants from Grenada
Sioux
94.8%
7TH GRADE
0.0/ 100
METRIC RATING
291st/ 347
METRIC RANK
97.4%
7TH GRADE
100.0/ 100
METRIC RATING
28th/ 347
METRIC RANK
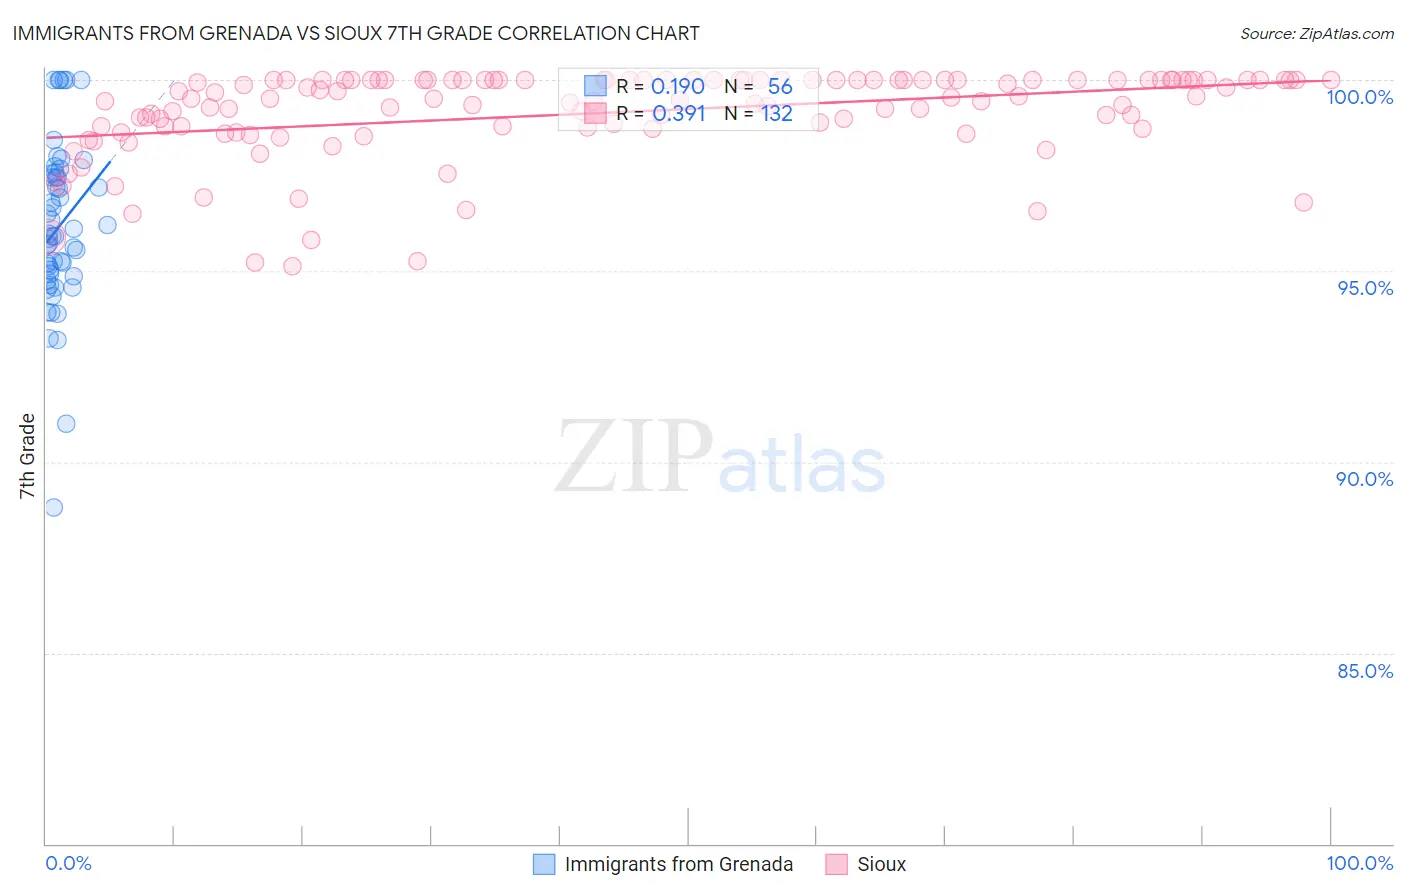
Immigrants from Grenada vs Sioux 7th Grade Correlation Chart
The statistical analysis conducted on geographies consisting of 67,191,509 people shows a poor positive correlation between the proportion of Immigrants from Grenada and percentage of population with at least 7th grade education in the United States with a correlation coefficient (R) of 0.190 and weighted average of 94.8%. Similarly, the statistical analysis conducted on geographies consisting of 234,197,525 people shows a mild positive correlation between the proportion of Sioux and percentage of population with at least 7th grade education in the United States with a correlation coefficient (R) of 0.391 and weighted average of 97.4%, a difference of 2.7%.
7th Grade Correlation Summary
| Measurement | Immigrants from Grenada | Sioux |
| Minimum | 88.8% | 95.1% |
| Maximum | 100.0% | 100.0% |
| Range | 11.2% | 4.9% |
| Mean | 96.2% | 99.1% |
| Median | 95.9% | 99.5% |
| Interquartile 25% (IQ1) | 94.9% | 98.8% |
| Interquartile 75% (IQ3) | 97.5% | 100.0% |
| Interquartile Range (IQR) | 2.6% | 1.2% |
| Standard Deviation (Sample) | 2.2% | 1.2% |
| Standard Deviation (Population) | 2.2% | 1.2% |
Similar Demographics by 7th Grade
Demographics Similar to Immigrants from Grenada by 7th Grade
In terms of 7th grade, the demographic groups most similar to Immigrants from Grenada are Immigrants from West Indies (94.8%, a difference of 0.020%), Malaysian (94.8%, a difference of 0.040%), Fijian (94.7%, a difference of 0.040%), Taiwanese (94.8%, a difference of 0.060%), and British West Indian (94.8%, a difference of 0.070%).
| Demographics | Rating | Rank | 7th Grade |
| Armenians | 0.1 /100 | #284 | Tragic 95.0% |
| Immigrants | Eritrea | 0.1 /100 | #285 | Tragic 94.9% |
| Immigrants | Philippines | 0.0 /100 | #286 | Tragic 94.9% |
| Immigrants | Peru | 0.0 /100 | #287 | Tragic 94.9% |
| British West Indians | 0.0 /100 | #288 | Tragic 94.8% |
| Taiwanese | 0.0 /100 | #289 | Tragic 94.8% |
| Malaysians | 0.0 /100 | #290 | Tragic 94.8% |
| Immigrants | Grenada | 0.0 /100 | #291 | Tragic 94.8% |
| Immigrants | West Indies | 0.0 /100 | #292 | Tragic 94.8% |
| Fijians | 0.0 /100 | #293 | Tragic 94.7% |
| Haitians | 0.0 /100 | #294 | Tragic 94.7% |
| Yaqui | 0.0 /100 | #295 | Tragic 94.6% |
| Cubans | 0.0 /100 | #296 | Tragic 94.6% |
| Immigrants | South Eastern Asia | 0.0 /100 | #297 | Tragic 94.5% |
| Indonesians | 0.0 /100 | #298 | Tragic 94.5% |
Demographics Similar to Sioux by 7th Grade
In terms of 7th grade, the demographic groups most similar to Sioux are Scandinavian (97.4%, a difference of 0.0%), Czech (97.4%, a difference of 0.010%), Scotch-Irish (97.4%, a difference of 0.020%), Danish (97.4%, a difference of 0.020%), and Welsh (97.4%, a difference of 0.030%).
| Demographics | Rating | Rank | 7th Grade |
| Inupiat | 100.0 /100 | #21 | Exceptional 97.4% |
| French Canadians | 100.0 /100 | #22 | Exceptional 97.4% |
| Croatians | 100.0 /100 | #23 | Exceptional 97.4% |
| Welsh | 100.0 /100 | #24 | Exceptional 97.4% |
| French | 100.0 /100 | #25 | Exceptional 97.4% |
| Scotch-Irish | 100.0 /100 | #26 | Exceptional 97.4% |
| Danes | 100.0 /100 | #27 | Exceptional 97.4% |
| Sioux | 100.0 /100 | #28 | Exceptional 97.4% |
| Scandinavians | 100.0 /100 | #29 | Exceptional 97.4% |
| Czechs | 100.0 /100 | #30 | Exceptional 97.4% |
| Europeans | 100.0 /100 | #31 | Exceptional 97.3% |
| Italians | 100.0 /100 | #32 | Exceptional 97.3% |
| Chippewa | 100.0 /100 | #33 | Exceptional 97.3% |
| Alaska Natives | 100.0 /100 | #34 | Exceptional 97.3% |
| Swiss | 100.0 /100 | #35 | Exceptional 97.3% |