Immigrants from Ghana vs Sioux 7th Grade
COMPARE
Immigrants from Ghana
Sioux
7th Grade
7th Grade Comparison
Immigrants from Ghana
Sioux
95.2%
7TH GRADE
0.3/ 100
METRIC RATING
266th/ 347
METRIC RANK
97.4%
7TH GRADE
100.0/ 100
METRIC RATING
28th/ 347
METRIC RANK
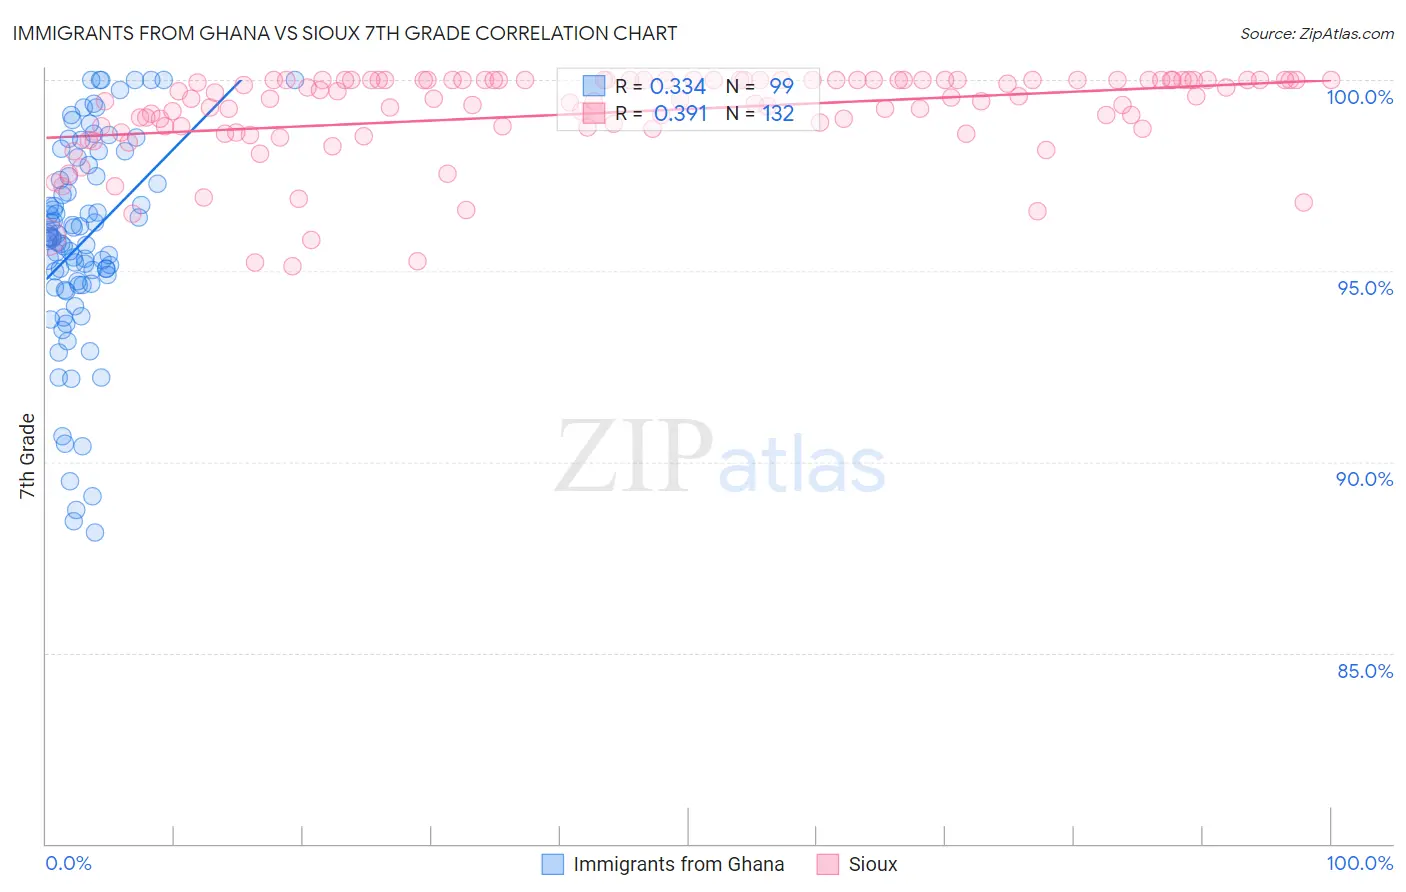
Immigrants from Ghana vs Sioux 7th Grade Correlation Chart
The statistical analysis conducted on geographies consisting of 199,952,023 people shows a mild positive correlation between the proportion of Immigrants from Ghana and percentage of population with at least 7th grade education in the United States with a correlation coefficient (R) of 0.334 and weighted average of 95.2%. Similarly, the statistical analysis conducted on geographies consisting of 234,197,525 people shows a mild positive correlation between the proportion of Sioux and percentage of population with at least 7th grade education in the United States with a correlation coefficient (R) of 0.391 and weighted average of 97.4%, a difference of 2.3%.
7th Grade Correlation Summary
| Measurement | Immigrants from Ghana | Sioux |
| Minimum | 88.2% | 95.1% |
| Maximum | 100.0% | 100.0% |
| Range | 11.8% | 4.9% |
| Mean | 95.8% | 99.1% |
| Median | 95.9% | 99.5% |
| Interquartile 25% (IQ1) | 94.6% | 98.8% |
| Interquartile 75% (IQ3) | 97.5% | 100.0% |
| Interquartile Range (IQR) | 2.8% | 1.2% |
| Standard Deviation (Sample) | 2.7% | 1.2% |
| Standard Deviation (Population) | 2.7% | 1.2% |
Similar Demographics by 7th Grade
Demographics Similar to Immigrants from Ghana by 7th Grade
In terms of 7th grade, the demographic groups most similar to Immigrants from Ghana are Immigrants from Uruguay (95.2%, a difference of 0.0%), Yuman (95.2%, a difference of 0.010%), Immigrants from Hong Kong (95.2%, a difference of 0.020%), Immigrants from Nigeria (95.2%, a difference of 0.040%), and Trinidadian and Tobagonian (95.2%, a difference of 0.040%).
| Demographics | Rating | Rank | 7th Grade |
| Immigrants | Costa Rica | 0.6 /100 | #259 | Tragic 95.3% |
| Afghans | 0.5 /100 | #260 | Tragic 95.3% |
| South Americans | 0.5 /100 | #261 | Tragic 95.2% |
| Immigrants | Somalia | 0.5 /100 | #262 | Tragic 95.2% |
| West Indians | 0.5 /100 | #263 | Tragic 95.2% |
| Immigrants | Nigeria | 0.4 /100 | #264 | Tragic 95.2% |
| Immigrants | Uruguay | 0.3 /100 | #265 | Tragic 95.2% |
| Immigrants | Ghana | 0.3 /100 | #266 | Tragic 95.2% |
| Yuman | 0.3 /100 | #267 | Tragic 95.2% |
| Immigrants | Hong Kong | 0.3 /100 | #268 | Tragic 95.2% |
| Trinidadians and Tobagonians | 0.3 /100 | #269 | Tragic 95.2% |
| Houma | 0.2 /100 | #270 | Tragic 95.1% |
| Immigrants | South America | 0.2 /100 | #271 | Tragic 95.1% |
| Peruvians | 0.2 /100 | #272 | Tragic 95.1% |
| Immigrants | Uzbekistan | 0.2 /100 | #273 | Tragic 95.1% |
Demographics Similar to Sioux by 7th Grade
In terms of 7th grade, the demographic groups most similar to Sioux are Scandinavian (97.4%, a difference of 0.0%), Czech (97.4%, a difference of 0.010%), Scotch-Irish (97.4%, a difference of 0.020%), Danish (97.4%, a difference of 0.020%), and Welsh (97.4%, a difference of 0.030%).
| Demographics | Rating | Rank | 7th Grade |
| Inupiat | 100.0 /100 | #21 | Exceptional 97.4% |
| French Canadians | 100.0 /100 | #22 | Exceptional 97.4% |
| Croatians | 100.0 /100 | #23 | Exceptional 97.4% |
| Welsh | 100.0 /100 | #24 | Exceptional 97.4% |
| French | 100.0 /100 | #25 | Exceptional 97.4% |
| Scotch-Irish | 100.0 /100 | #26 | Exceptional 97.4% |
| Danes | 100.0 /100 | #27 | Exceptional 97.4% |
| Sioux | 100.0 /100 | #28 | Exceptional 97.4% |
| Scandinavians | 100.0 /100 | #29 | Exceptional 97.4% |
| Czechs | 100.0 /100 | #30 | Exceptional 97.4% |
| Europeans | 100.0 /100 | #31 | Exceptional 97.3% |
| Italians | 100.0 /100 | #32 | Exceptional 97.3% |
| Chippewa | 100.0 /100 | #33 | Exceptional 97.3% |
| Alaska Natives | 100.0 /100 | #34 | Exceptional 97.3% |
| Swiss | 100.0 /100 | #35 | Exceptional 97.3% |