Indian (Asian) vs Sioux 7th Grade
COMPARE
Indian (Asian)
Sioux
7th Grade
7th Grade Comparison
Indians (Asian)
Sioux
95.5%
7TH GRADE
2.3/ 100
METRIC RATING
238th/ 347
METRIC RANK
97.4%
7TH GRADE
100.0/ 100
METRIC RATING
28th/ 347
METRIC RANK
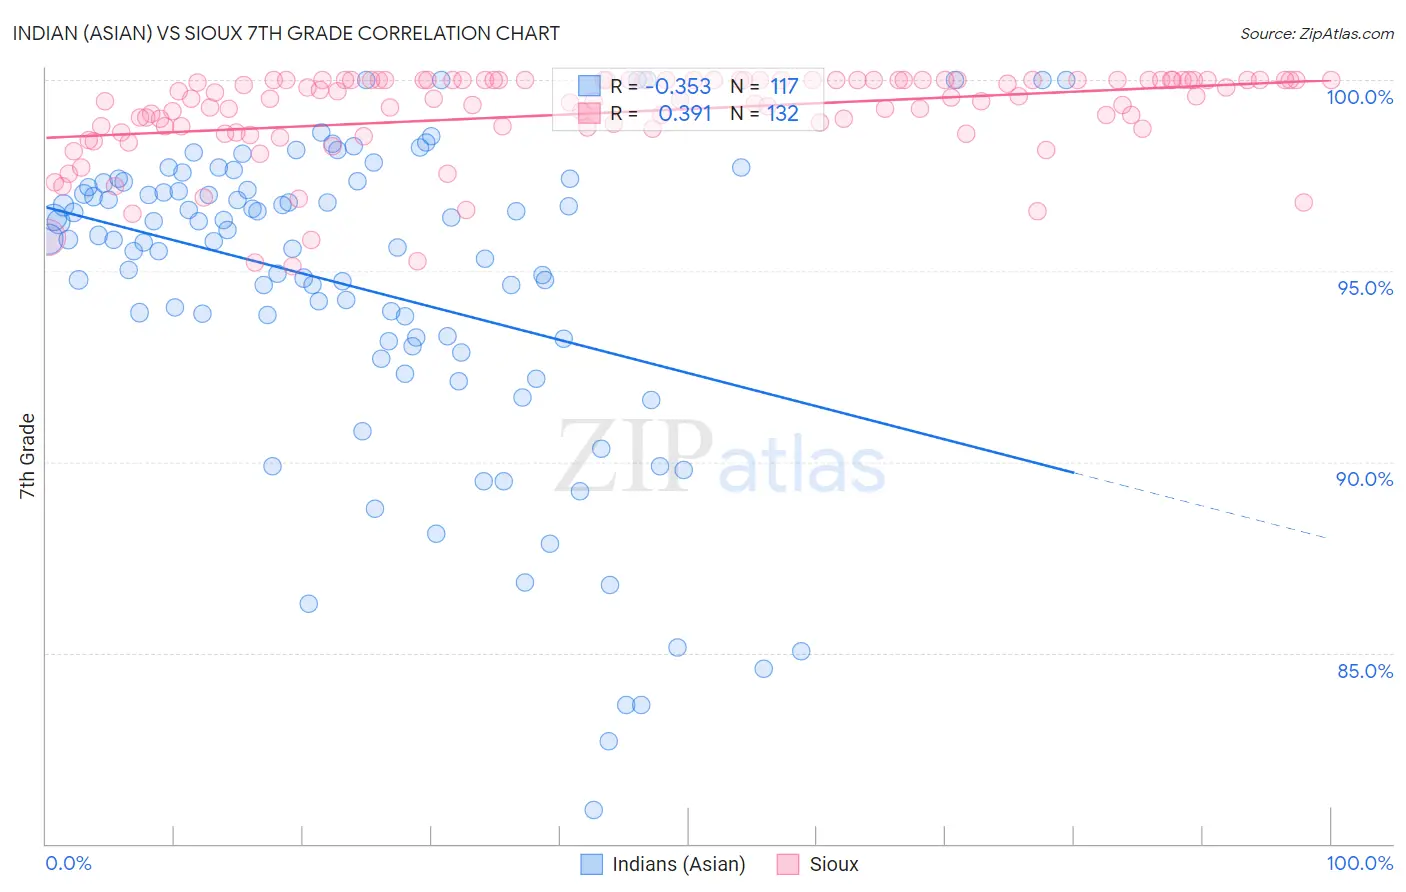
Indian (Asian) vs Sioux 7th Grade Correlation Chart
The statistical analysis conducted on geographies consisting of 495,348,182 people shows a mild negative correlation between the proportion of Indians (Asian) and percentage of population with at least 7th grade education in the United States with a correlation coefficient (R) of -0.353 and weighted average of 95.5%. Similarly, the statistical analysis conducted on geographies consisting of 234,197,525 people shows a mild positive correlation between the proportion of Sioux and percentage of population with at least 7th grade education in the United States with a correlation coefficient (R) of 0.391 and weighted average of 97.4%, a difference of 2.0%.
7th Grade Correlation Summary
| Measurement | Indian (Asian) | Sioux |
| Minimum | 80.9% | 95.1% |
| Maximum | 100.0% | 100.0% |
| Range | 19.1% | 4.9% |
| Mean | 94.5% | 99.1% |
| Median | 95.8% | 99.5% |
| Interquartile 25% (IQ1) | 93.1% | 98.8% |
| Interquartile 75% (IQ3) | 97.2% | 100.0% |
| Interquartile Range (IQR) | 4.1% | 1.2% |
| Standard Deviation (Sample) | 4.1% | 1.2% |
| Standard Deviation (Population) | 4.1% | 1.2% |
Similar Demographics by 7th Grade
Demographics Similar to Indians (Asian) by 7th Grade
In terms of 7th grade, the demographic groups most similar to Indians (Asian) are Immigrants from Asia (95.5%, a difference of 0.0%), Jamaican (95.5%, a difference of 0.010%), Asian (95.5%, a difference of 0.020%), Immigrants from Sierra Leone (95.5%, a difference of 0.020%), and South American Indian (95.5%, a difference of 0.020%).
| Demographics | Rating | Rank | 7th Grade |
| Senegalese | 4.0 /100 | #231 | Tragic 95.6% |
| Costa Ricans | 3.3 /100 | #232 | Tragic 95.5% |
| Immigrants | Indonesia | 3.3 /100 | #233 | Tragic 95.5% |
| Nigerians | 3.0 /100 | #234 | Tragic 95.5% |
| Immigrants | Africa | 2.7 /100 | #235 | Tragic 95.5% |
| Asians | 2.6 /100 | #236 | Tragic 95.5% |
| Immigrants | Asia | 2.3 /100 | #237 | Tragic 95.5% |
| Indians (Asian) | 2.3 /100 | #238 | Tragic 95.5% |
| Jamaicans | 2.2 /100 | #239 | Tragic 95.5% |
| Immigrants | Sierra Leone | 2.0 /100 | #240 | Tragic 95.5% |
| South American Indians | 2.0 /100 | #241 | Tragic 95.5% |
| Immigrants | Senegal | 1.9 /100 | #242 | Tragic 95.5% |
| U.S. Virgin Islanders | 1.6 /100 | #243 | Tragic 95.4% |
| Uruguayans | 1.6 /100 | #244 | Tragic 95.4% |
| Immigrants | Middle Africa | 1.5 /100 | #245 | Tragic 95.4% |
Demographics Similar to Sioux by 7th Grade
In terms of 7th grade, the demographic groups most similar to Sioux are Scandinavian (97.4%, a difference of 0.0%), Czech (97.4%, a difference of 0.010%), Scotch-Irish (97.4%, a difference of 0.020%), Danish (97.4%, a difference of 0.020%), and Welsh (97.4%, a difference of 0.030%).
| Demographics | Rating | Rank | 7th Grade |
| Inupiat | 100.0 /100 | #21 | Exceptional 97.4% |
| French Canadians | 100.0 /100 | #22 | Exceptional 97.4% |
| Croatians | 100.0 /100 | #23 | Exceptional 97.4% |
| Welsh | 100.0 /100 | #24 | Exceptional 97.4% |
| French | 100.0 /100 | #25 | Exceptional 97.4% |
| Scotch-Irish | 100.0 /100 | #26 | Exceptional 97.4% |
| Danes | 100.0 /100 | #27 | Exceptional 97.4% |
| Sioux | 100.0 /100 | #28 | Exceptional 97.4% |
| Scandinavians | 100.0 /100 | #29 | Exceptional 97.4% |
| Czechs | 100.0 /100 | #30 | Exceptional 97.4% |
| Europeans | 100.0 /100 | #31 | Exceptional 97.3% |
| Italians | 100.0 /100 | #32 | Exceptional 97.3% |
| Chippewa | 100.0 /100 | #33 | Exceptional 97.3% |
| Alaska Natives | 100.0 /100 | #34 | Exceptional 97.3% |
| Swiss | 100.0 /100 | #35 | Exceptional 97.3% |