Immigrants from Greece vs Brazilian 5th Grade
COMPARE
Immigrants from Greece
Brazilian
5th Grade
5th Grade Comparison
Immigrants from Greece
Brazilians
97.5%
5TH GRADE
83.2/ 100
METRIC RATING
144th/ 347
METRIC RANK
97.2%
5TH GRADE
25.4/ 100
METRIC RATING
197th/ 347
METRIC RANK
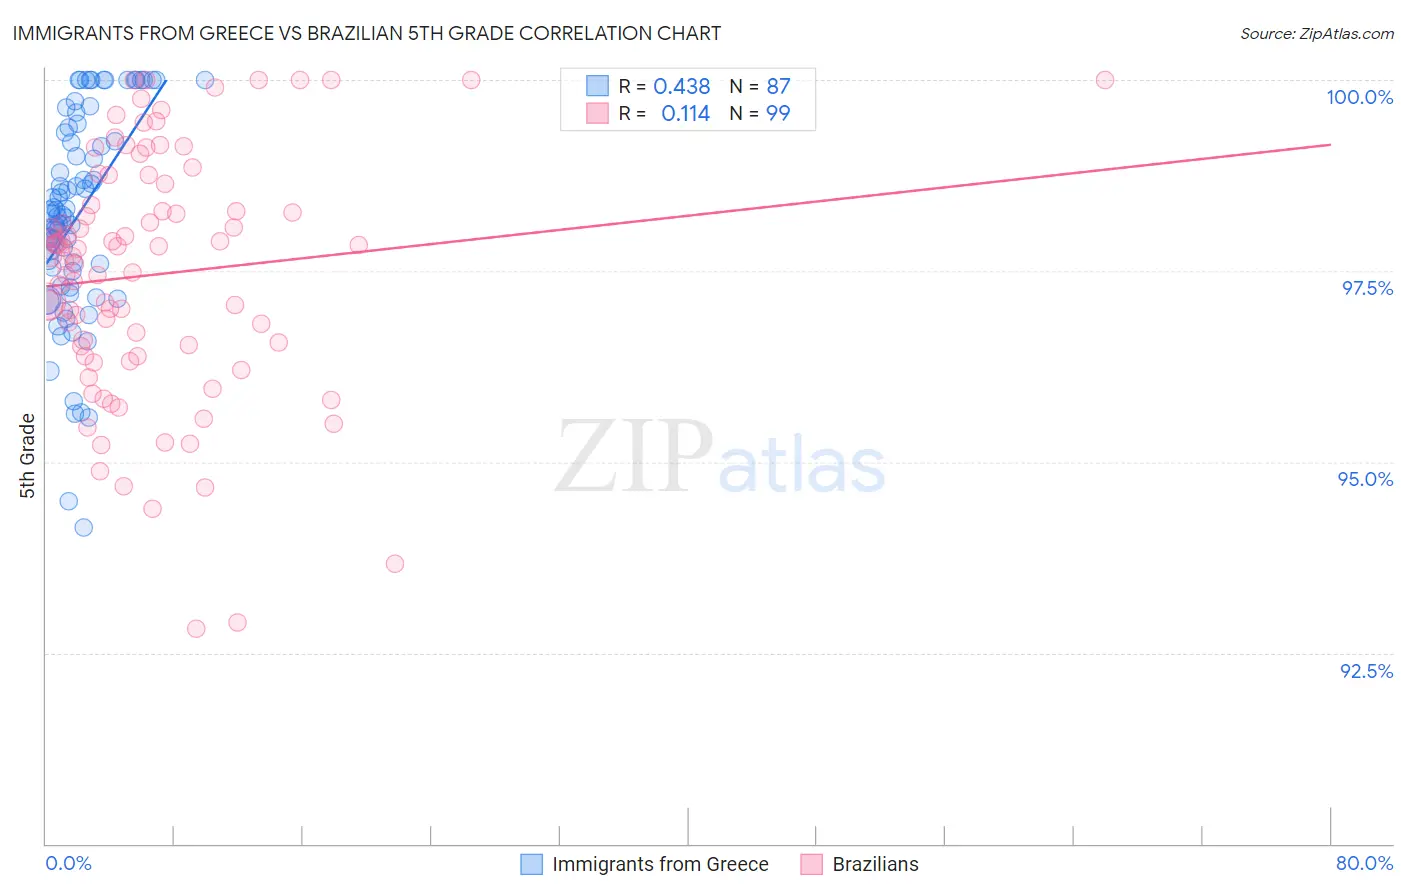
Immigrants from Greece vs Brazilian 5th Grade Correlation Chart
The statistical analysis conducted on geographies consisting of 216,879,847 people shows a moderate positive correlation between the proportion of Immigrants from Greece and percentage of population with at least 5th grade education in the United States with a correlation coefficient (R) of 0.438 and weighted average of 97.5%. Similarly, the statistical analysis conducted on geographies consisting of 323,962,626 people shows a poor positive correlation between the proportion of Brazilians and percentage of population with at least 5th grade education in the United States with a correlation coefficient (R) of 0.114 and weighted average of 97.2%, a difference of 0.28%.
5th Grade Correlation Summary
| Measurement | Immigrants from Greece | Brazilian |
| Minimum | 94.1% | 92.8% |
| Maximum | 100.0% | 100.0% |
| Range | 5.9% | 7.2% |
| Mean | 98.2% | 97.5% |
| Median | 98.2% | 97.7% |
| Interquartile 25% (IQ1) | 97.5% | 96.4% |
| Interquartile 75% (IQ3) | 99.3% | 98.6% |
| Interquartile Range (IQR) | 1.8% | 2.3% |
| Standard Deviation (Sample) | 1.3% | 1.6% |
| Standard Deviation (Population) | 1.3% | 1.6% |
Similar Demographics by 5th Grade
Demographics Similar to Immigrants from Greece by 5th Grade
In terms of 5th grade, the demographic groups most similar to Immigrants from Greece are Jordanian (97.5%, a difference of 0.0%), Spaniard (97.5%, a difference of 0.010%), Soviet Union (97.5%, a difference of 0.010%), Burmese (97.5%, a difference of 0.020%), and Seminole (97.5%, a difference of 0.020%).
| Demographics | Rating | Rank | 5th Grade |
| Filipinos | 86.8 /100 | #137 | Excellent 97.5% |
| Blackfeet | 86.8 /100 | #138 | Excellent 97.5% |
| Immigrants | Turkey | 86.7 /100 | #139 | Excellent 97.5% |
| Burmese | 86.1 /100 | #140 | Excellent 97.5% |
| Seminole | 85.8 /100 | #141 | Excellent 97.5% |
| Israelis | 85.5 /100 | #142 | Excellent 97.5% |
| Immigrants | North Macedonia | 85.4 /100 | #143 | Excellent 97.5% |
| Immigrants | Greece | 83.2 /100 | #144 | Excellent 97.5% |
| Jordanians | 82.6 /100 | #145 | Excellent 97.5% |
| Spaniards | 81.9 /100 | #146 | Excellent 97.5% |
| Soviet Union | 81.2 /100 | #147 | Excellent 97.5% |
| Immigrants | Israel | 79.1 /100 | #148 | Good 97.5% |
| Hopi | 78.6 /100 | #149 | Good 97.5% |
| Immigrants | South Central Asia | 78.6 /100 | #150 | Good 97.5% |
| Immigrants | Eastern Europe | 75.0 /100 | #151 | Good 97.4% |
Demographics Similar to Brazilians by 5th Grade
In terms of 5th grade, the demographic groups most similar to Brazilians are Hawaiian (97.2%, a difference of 0.0%), Guamanian/Chamorro (97.2%, a difference of 0.010%), Navajo (97.2%, a difference of 0.020%), Immigrants from Albania (97.2%, a difference of 0.020%), and Black/African American (97.3%, a difference of 0.030%).
| Demographics | Rating | Rank | 5th Grade |
| Blacks/African Americans | 31.8 /100 | #190 | Fair 97.3% |
| Immigrants | Brazil | 31.5 /100 | #191 | Fair 97.3% |
| Panamanians | 31.3 /100 | #192 | Fair 97.3% |
| Navajo | 29.0 /100 | #193 | Fair 97.2% |
| Immigrants | Albania | 28.5 /100 | #194 | Fair 97.2% |
| Guamanians/Chamorros | 26.8 /100 | #195 | Fair 97.2% |
| Hawaiians | 25.6 /100 | #196 | Fair 97.2% |
| Brazilians | 25.4 /100 | #197 | Fair 97.2% |
| Immigrants | Uganda | 21.1 /100 | #198 | Fair 97.2% |
| Natives/Alaskans | 18.0 /100 | #199 | Poor 97.2% |
| Immigrants | Northern Africa | 16.8 /100 | #200 | Poor 97.2% |
| Immigrants | Chile | 16.6 /100 | #201 | Poor 97.2% |
| Africans | 15.3 /100 | #202 | Poor 97.2% |
| Immigrants | Bahamas | 14.9 /100 | #203 | Poor 97.2% |
| Immigrants | Zaire | 13.7 /100 | #204 | Poor 97.1% |