Immigrants from Germany vs Liberian High School Diploma
COMPARE
Immigrants from Germany
Liberian
High School Diploma
High School Diploma Comparison
Immigrants from Germany
Liberians
90.2%
HIGH SCHOOL DIPLOMA
95.7/ 100
METRIC RATING
116th/ 347
METRIC RANK
88.7%
HIGH SCHOOL DIPLOMA
18.8/ 100
METRIC RATING
198th/ 347
METRIC RANK
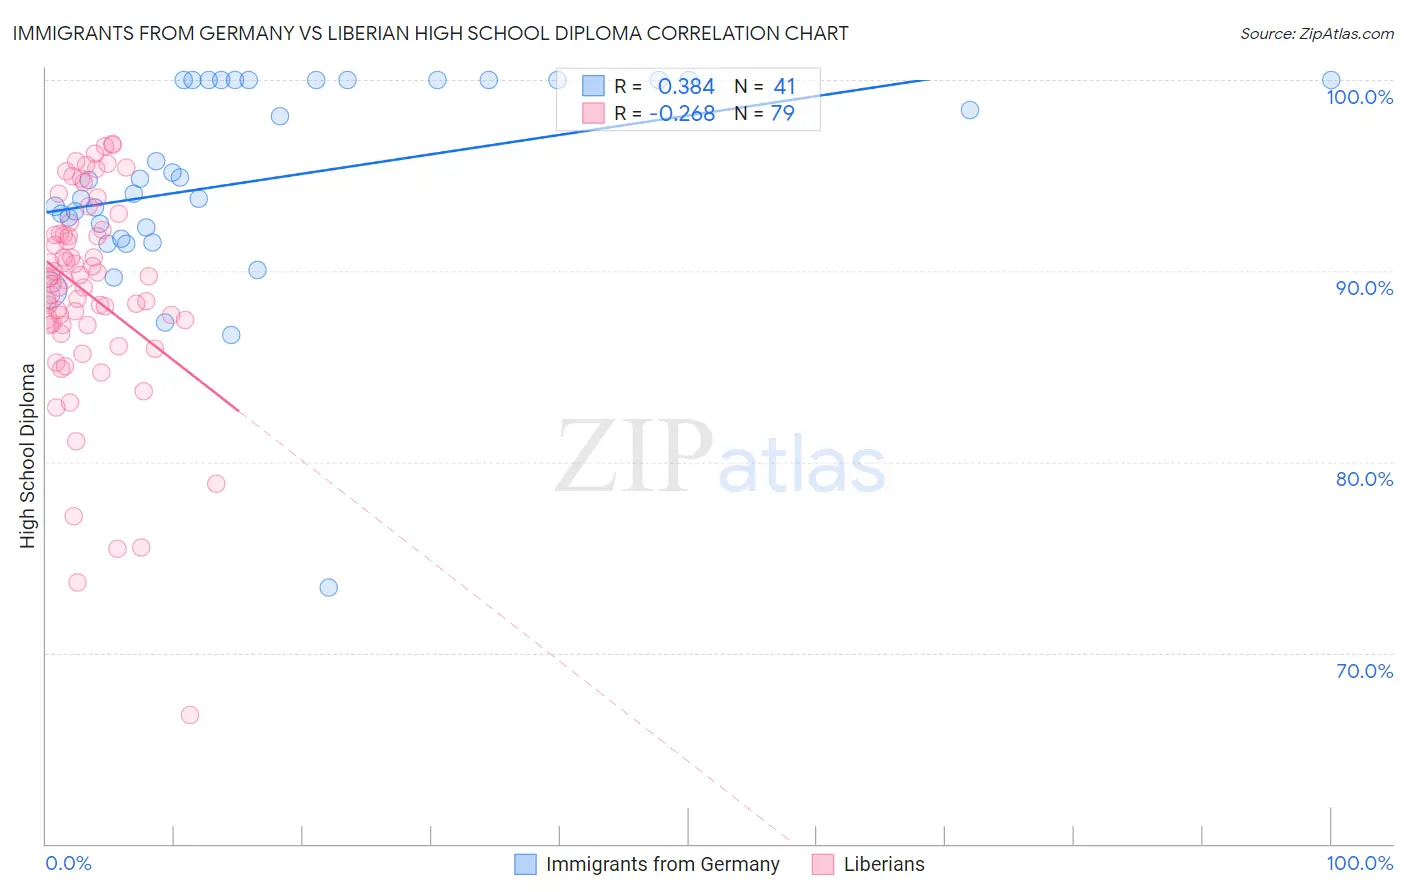
Immigrants from Germany vs Liberian High School Diploma Correlation Chart
The statistical analysis conducted on geographies consisting of 463,886,776 people shows a mild positive correlation between the proportion of Immigrants from Germany and percentage of population with at least high school diploma education in the United States with a correlation coefficient (R) of 0.384 and weighted average of 90.2%. Similarly, the statistical analysis conducted on geographies consisting of 118,101,728 people shows a weak negative correlation between the proportion of Liberians and percentage of population with at least high school diploma education in the United States with a correlation coefficient (R) of -0.268 and weighted average of 88.7%, a difference of 1.7%.
High School Diploma Correlation Summary
| Measurement | Immigrants from Germany | Liberian |
| Minimum | 73.4% | 66.8% |
| Maximum | 100.0% | 96.6% |
| Range | 26.6% | 29.9% |
| Mean | 94.8% | 88.8% |
| Median | 94.7% | 89.5% |
| Interquartile 25% (IQ1) | 92.0% | 87.2% |
| Interquartile 75% (IQ3) | 100.0% | 91.9% |
| Interquartile Range (IQR) | 8.0% | 4.8% |
| Standard Deviation (Sample) | 5.3% | 5.5% |
| Standard Deviation (Population) | 5.3% | 5.5% |
Similar Demographics by High School Diploma
Demographics Similar to Immigrants from Germany by High School Diploma
In terms of high school diploma, the demographic groups most similar to Immigrants from Germany are Immigrants from Hungary (90.2%, a difference of 0.010%), Jordanian (90.2%, a difference of 0.030%), Yugoslavian (90.2%, a difference of 0.050%), Israeli (90.1%, a difference of 0.050%), and Immigrants from Sri Lanka (90.2%, a difference of 0.060%).
| Demographics | Rating | Rank | High School Diploma |
| Immigrants | Zimbabwe | 96.7 /100 | #109 | Exceptional 90.3% |
| Immigrants | Greece | 96.6 /100 | #110 | Exceptional 90.3% |
| Menominee | 96.6 /100 | #111 | Exceptional 90.3% |
| Immigrants | Belarus | 96.4 /100 | #112 | Exceptional 90.2% |
| Immigrants | Sri Lanka | 96.3 /100 | #113 | Exceptional 90.2% |
| Yugoslavians | 96.2 /100 | #114 | Exceptional 90.2% |
| Immigrants | Hungary | 95.8 /100 | #115 | Exceptional 90.2% |
| Immigrants | Germany | 95.7 /100 | #116 | Exceptional 90.2% |
| Jordanians | 95.4 /100 | #117 | Exceptional 90.2% |
| Israelis | 95.1 /100 | #118 | Exceptional 90.1% |
| Immigrants | Eastern Europe | 94.9 /100 | #119 | Exceptional 90.1% |
| Ottawa | 94.4 /100 | #120 | Exceptional 90.1% |
| Whites/Caucasians | 94.1 /100 | #121 | Exceptional 90.1% |
| Immigrants | Kazakhstan | 93.4 /100 | #122 | Exceptional 90.0% |
| German Russians | 92.0 /100 | #123 | Exceptional 90.0% |
Demographics Similar to Liberians by High School Diploma
In terms of high school diploma, the demographic groups most similar to Liberians are Marshallese (88.6%, a difference of 0.0%), Hawaiian (88.6%, a difference of 0.010%), Korean (88.6%, a difference of 0.020%), Panamanian (88.6%, a difference of 0.020%), and Somali (88.6%, a difference of 0.030%).
| Demographics | Rating | Rank | High School Diploma |
| Immigrants | Ethiopia | 30.9 /100 | #191 | Fair 88.9% |
| Moroccans | 29.5 /100 | #192 | Fair 88.8% |
| Immigrants | Oceania | 26.9 /100 | #193 | Fair 88.8% |
| Immigrants | Venezuela | 25.8 /100 | #194 | Fair 88.8% |
| Afghans | 23.9 /100 | #195 | Fair 88.8% |
| Immigrants | Southern Europe | 23.4 /100 | #196 | Fair 88.7% |
| French American Indians | 21.5 /100 | #197 | Fair 88.7% |
| Liberians | 18.8 /100 | #198 | Poor 88.7% |
| Marshallese | 18.7 /100 | #199 | Poor 88.6% |
| Hawaiians | 18.3 /100 | #200 | Poor 88.6% |
| Koreans | 18.1 /100 | #201 | Poor 88.6% |
| Panamanians | 18.0 /100 | #202 | Poor 88.6% |
| Somalis | 17.5 /100 | #203 | Poor 88.6% |
| Armenians | 17.2 /100 | #204 | Poor 88.6% |
| Immigrants | Micronesia | 16.4 /100 | #205 | Poor 88.6% |