Immigrants from Germany vs Alaska Native 11th Grade
COMPARE
Immigrants from Germany
Alaska Native
11th Grade
11th Grade Comparison
Immigrants from Germany
Alaska Natives
93.4%
11TH GRADE
98.0/ 100
METRIC RATING
112th/ 347
METRIC RANK
93.5%
11TH GRADE
98.4/ 100
METRIC RATING
108th/ 347
METRIC RANK
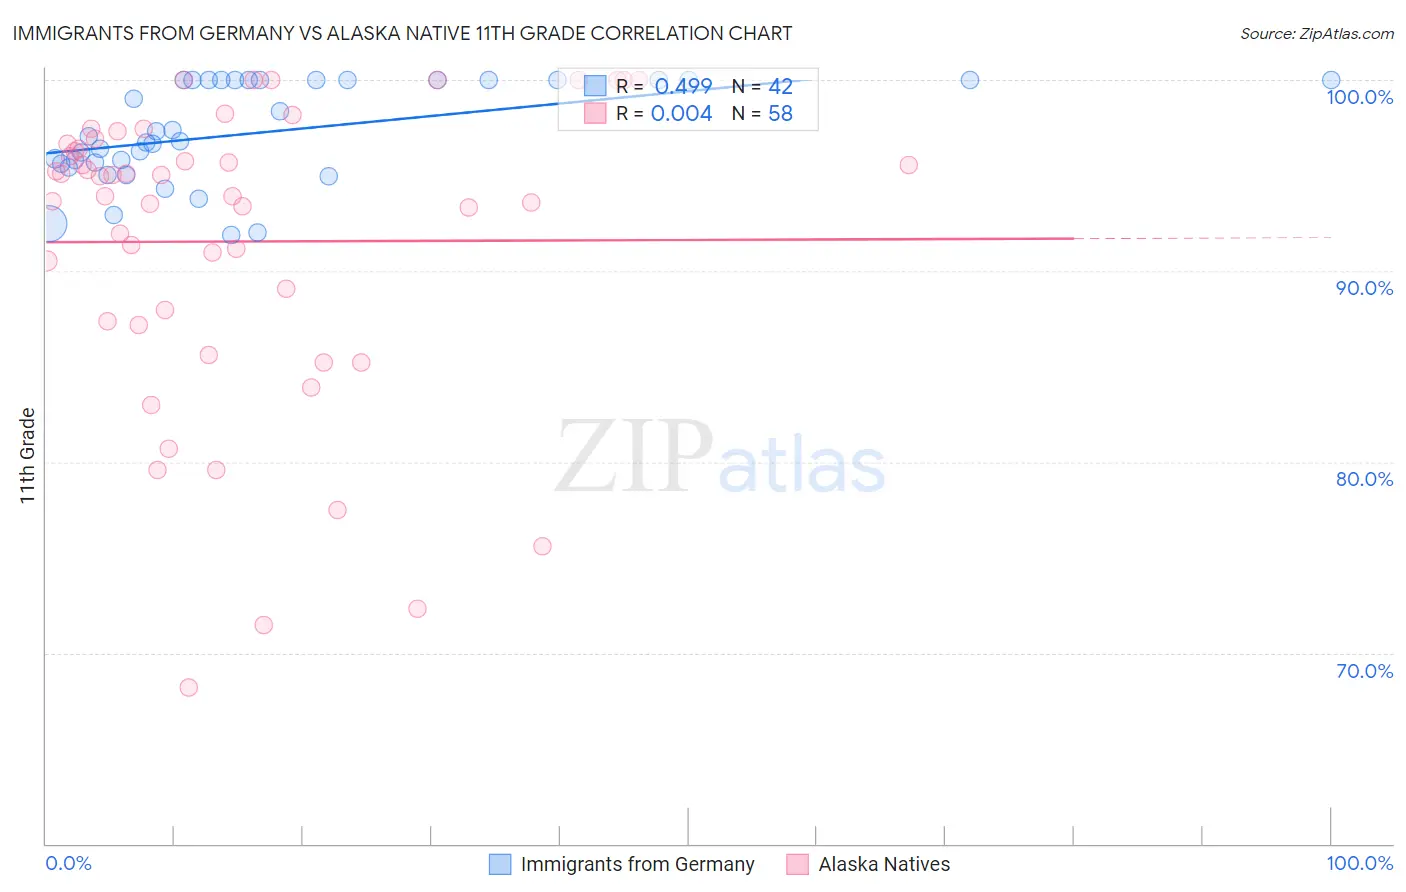
Immigrants from Germany vs Alaska Native 11th Grade Correlation Chart
The statistical analysis conducted on geographies consisting of 463,886,920 people shows a moderate positive correlation between the proportion of Immigrants from Germany and percentage of population with at least 11th grade education in the United States with a correlation coefficient (R) of 0.499 and weighted average of 93.4%. Similarly, the statistical analysis conducted on geographies consisting of 76,778,827 people shows no correlation between the proportion of Alaska Natives and percentage of population with at least 11th grade education in the United States with a correlation coefficient (R) of 0.004 and weighted average of 93.5%, a difference of 0.060%.
11th Grade Correlation Summary
| Measurement | Immigrants from Germany | Alaska Native |
| Minimum | 91.9% | 68.2% |
| Maximum | 100.0% | 100.0% |
| Range | 8.1% | 31.8% |
| Mean | 97.3% | 91.5% |
| Median | 96.9% | 94.4% |
| Interquartile 25% (IQ1) | 95.6% | 87.4% |
| Interquartile 75% (IQ3) | 100.0% | 96.6% |
| Interquartile Range (IQR) | 4.4% | 9.3% |
| Standard Deviation (Sample) | 2.6% | 7.9% |
| Standard Deviation (Population) | 2.6% | 7.8% |
Demographics Similar to Immigrants from Germany and Alaska Natives by 11th Grade
In terms of 11th grade, the demographic groups most similar to Immigrants from Germany are Yugoslavian (93.4%, a difference of 0.010%), Immigrants from Zimbabwe (93.4%, a difference of 0.030%), Jordanian (93.4%, a difference of 0.030%), Syrian (93.4%, a difference of 0.040%), and Palestinian (93.4%, a difference of 0.040%). Similarly, the demographic groups most similar to Alaska Natives are Immigrants from Norway (93.5%, a difference of 0.0%), Immigrants from Kuwait (93.5%, a difference of 0.0%), Syrian (93.4%, a difference of 0.010%), Immigrants from Europe (93.5%, a difference of 0.020%), and Immigrants from Serbia (93.5%, a difference of 0.020%).
| Demographics | Rating | Rank | 11th Grade |
| Immigrants | North Macedonia | 98.7 /100 | #100 | Exceptional 93.5% |
| Immigrants | Romania | 98.7 /100 | #101 | Exceptional 93.5% |
| Chippewa | 98.6 /100 | #102 | Exceptional 93.5% |
| Lebanese | 98.6 /100 | #103 | Exceptional 93.5% |
| Immigrants | Europe | 98.6 /100 | #104 | Exceptional 93.5% |
| Immigrants | Serbia | 98.6 /100 | #105 | Exceptional 93.5% |
| Immigrants | Croatia | 98.6 /100 | #106 | Exceptional 93.5% |
| Immigrants | Norway | 98.4 /100 | #107 | Exceptional 93.5% |
| Alaska Natives | 98.4 /100 | #108 | Exceptional 93.5% |
| Immigrants | Kuwait | 98.4 /100 | #109 | Exceptional 93.5% |
| Syrians | 98.4 /100 | #110 | Exceptional 93.4% |
| Yugoslavians | 98.1 /100 | #111 | Exceptional 93.4% |
| Immigrants | Germany | 98.0 /100 | #112 | Exceptional 93.4% |
| Immigrants | Zimbabwe | 97.8 /100 | #113 | Exceptional 93.4% |
| Jordanians | 97.8 /100 | #114 | Exceptional 93.4% |
| Palestinians | 97.7 /100 | #115 | Exceptional 93.4% |
| Immigrants | Hungary | 97.5 /100 | #116 | Exceptional 93.4% |
| Whites/Caucasians | 97.4 /100 | #117 | Exceptional 93.3% |
| Immigrants | Korea | 97.0 /100 | #118 | Exceptional 93.3% |
| Israelis | 97.0 /100 | #119 | Exceptional 93.3% |
| Immigrants | Russia | 96.6 /100 | #120 | Exceptional 93.3% |