Immigrants from Europe vs Irish 6th Grade
COMPARE
Immigrants from Europe
Irish
6th Grade
6th Grade Comparison
Immigrants from Europe
Irish
97.3%
6TH GRADE
91.1/ 100
METRIC RATING
131st/ 347
METRIC RANK
98.1%
6TH GRADE
100.0/ 100
METRIC RATING
19th/ 347
METRIC RANK
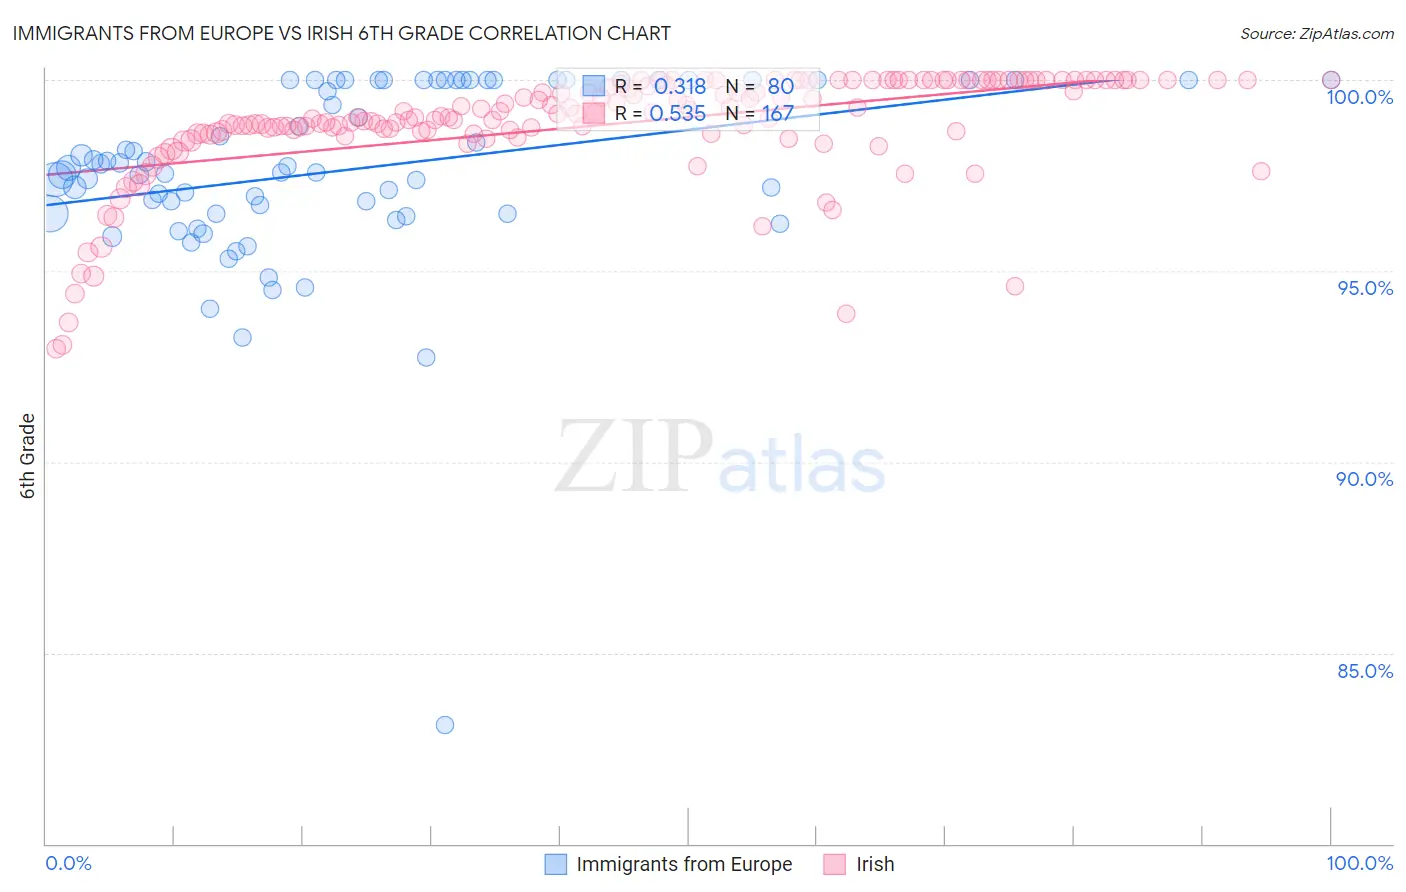
Immigrants from Europe vs Irish 6th Grade Correlation Chart
The statistical analysis conducted on geographies consisting of 547,425,973 people shows a mild positive correlation between the proportion of Immigrants from Europe and percentage of population with at least 6th grade education in the United States with a correlation coefficient (R) of 0.318 and weighted average of 97.3%. Similarly, the statistical analysis conducted on geographies consisting of 568,142,060 people shows a substantial positive correlation between the proportion of Irish and percentage of population with at least 6th grade education in the United States with a correlation coefficient (R) of 0.535 and weighted average of 98.1%, a difference of 0.81%.
6th Grade Correlation Summary
| Measurement | Immigrants from Europe | Irish |
| Minimum | 83.1% | 93.0% |
| Maximum | 100.0% | 100.0% |
| Range | 16.9% | 7.0% |
| Mean | 97.7% | 98.8% |
| Median | 97.7% | 99.0% |
| Interquartile 25% (IQ1) | 96.5% | 98.6% |
| Interquartile 75% (IQ3) | 100.0% | 100.0% |
| Interquartile Range (IQR) | 3.5% | 1.4% |
| Standard Deviation (Sample) | 2.5% | 1.4% |
| Standard Deviation (Population) | 2.5% | 1.4% |
Similar Demographics by 6th Grade
Demographics Similar to Immigrants from Europe by 6th Grade
In terms of 6th grade, the demographic groups most similar to Immigrants from Europe are Palestinian (97.3%, a difference of 0.0%), Immigrants from Romania (97.3%, a difference of 0.010%), Immigrants from Serbia (97.3%, a difference of 0.010%), Cambodian (97.3%, a difference of 0.010%), and Immigrants from Moldova (97.3%, a difference of 0.010%).
| Demographics | Rating | Rank | 6th Grade |
| Okinawans | 94.2 /100 | #124 | Exceptional 97.4% |
| Spanish | 93.7 /100 | #125 | Exceptional 97.3% |
| Immigrants | Bulgaria | 93.6 /100 | #126 | Exceptional 97.3% |
| Immigrants | Croatia | 93.1 /100 | #127 | Exceptional 97.3% |
| Immigrants | Romania | 92.0 /100 | #128 | Exceptional 97.3% |
| Immigrants | Serbia | 91.9 /100 | #129 | Exceptional 97.3% |
| Cambodians | 91.8 /100 | #130 | Exceptional 97.3% |
| Immigrants | Europe | 91.1 /100 | #131 | Exceptional 97.3% |
| Palestinians | 90.9 /100 | #132 | Exceptional 97.3% |
| Immigrants | Moldova | 90.0 /100 | #133 | Excellent 97.3% |
| Immigrants | Kuwait | 89.5 /100 | #134 | Excellent 97.3% |
| Immigrants | Hungary | 89.5 /100 | #135 | Excellent 97.3% |
| Filipinos | 88.9 /100 | #136 | Excellent 97.3% |
| Burmese | 87.8 /100 | #137 | Excellent 97.3% |
| Blackfeet | 87.7 /100 | #138 | Excellent 97.3% |
Demographics Similar to Irish by 6th Grade
In terms of 6th grade, the demographic groups most similar to Irish are Scottish (98.1%, a difference of 0.010%), Polish (98.1%, a difference of 0.010%), Pennsylvania German (98.1%, a difference of 0.010%), Finnish (98.1%, a difference of 0.010%), and Inupiat (98.1%, a difference of 0.020%).
| Demographics | Rating | Rank | 6th Grade |
| Alaskan Athabascans | 100.0 /100 | #12 | Exceptional 98.1% |
| Tlingit-Haida | 100.0 /100 | #13 | Exceptional 98.1% |
| Carpatho Rusyns | 100.0 /100 | #14 | Exceptional 98.1% |
| Inupiat | 100.0 /100 | #15 | Exceptional 98.1% |
| Scottish | 100.0 /100 | #16 | Exceptional 98.1% |
| Poles | 100.0 /100 | #17 | Exceptional 98.1% |
| Pennsylvania Germans | 100.0 /100 | #18 | Exceptional 98.1% |
| Irish | 100.0 /100 | #19 | Exceptional 98.1% |
| Finns | 100.0 /100 | #20 | Exceptional 98.1% |
| Lithuanians | 100.0 /100 | #21 | Exceptional 98.1% |
| Danes | 100.0 /100 | #22 | Exceptional 98.0% |
| Sioux | 100.0 /100 | #23 | Exceptional 98.0% |
| Croatians | 100.0 /100 | #24 | Exceptional 98.0% |
| Scotch-Irish | 100.0 /100 | #25 | Exceptional 98.0% |
| Czechs | 100.0 /100 | #26 | Exceptional 98.0% |