Immigrants from Cameroon vs Irish 6th Grade
COMPARE
Immigrants from Cameroon
Irish
6th Grade
6th Grade Comparison
Immigrants from Cameroon
Irish
96.3%
6TH GRADE
0.1/ 100
METRIC RATING
273rd/ 347
METRIC RANK
98.1%
6TH GRADE
100.0/ 100
METRIC RATING
19th/ 347
METRIC RANK
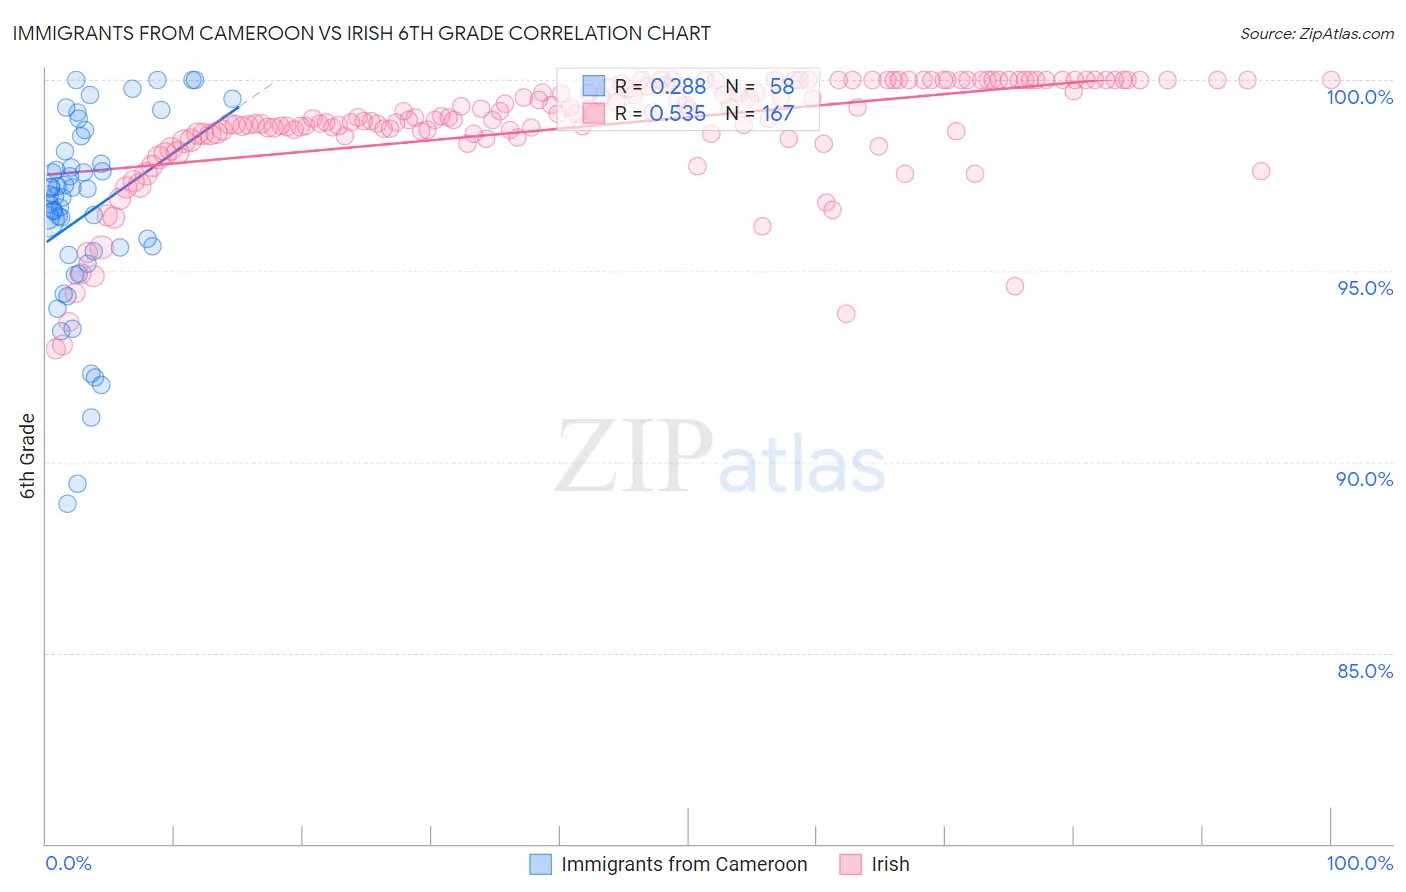
Immigrants from Cameroon vs Irish 6th Grade Correlation Chart
The statistical analysis conducted on geographies consisting of 130,752,798 people shows a weak positive correlation between the proportion of Immigrants from Cameroon and percentage of population with at least 6th grade education in the United States with a correlation coefficient (R) of 0.288 and weighted average of 96.3%. Similarly, the statistical analysis conducted on geographies consisting of 568,142,060 people shows a substantial positive correlation between the proportion of Irish and percentage of population with at least 6th grade education in the United States with a correlation coefficient (R) of 0.535 and weighted average of 98.1%, a difference of 1.9%.
6th Grade Correlation Summary
| Measurement | Immigrants from Cameroon | Irish |
| Minimum | 88.9% | 93.0% |
| Maximum | 100.0% | 100.0% |
| Range | 11.1% | 7.0% |
| Mean | 96.5% | 98.8% |
| Median | 96.9% | 99.0% |
| Interquartile 25% (IQ1) | 95.4% | 98.6% |
| Interquartile 75% (IQ3) | 97.8% | 100.0% |
| Interquartile Range (IQR) | 2.4% | 1.4% |
| Standard Deviation (Sample) | 2.5% | 1.4% |
| Standard Deviation (Population) | 2.5% | 1.4% |
Similar Demographics by 6th Grade
Demographics Similar to Immigrants from Cameroon by 6th Grade
In terms of 6th grade, the demographic groups most similar to Immigrants from Cameroon are Immigrants from Philippines (96.3%, a difference of 0.0%), Immigrants from Bolivia (96.3%, a difference of 0.010%), Immigrants from Ghana (96.3%, a difference of 0.010%), Yaqui (96.3%, a difference of 0.020%), and Immigrants from Western Africa (96.3%, a difference of 0.030%).
| Demographics | Rating | Rank | 6th Grade |
| Ghanaians | 0.2 /100 | #266 | Tragic 96.4% |
| Afghans | 0.2 /100 | #267 | Tragic 96.4% |
| Immigrants | Uzbekistan | 0.2 /100 | #268 | Tragic 96.3% |
| West Indians | 0.2 /100 | #269 | Tragic 96.3% |
| Immigrants | South America | 0.2 /100 | #270 | Tragic 96.3% |
| Immigrants | Hong Kong | 0.2 /100 | #271 | Tragic 96.3% |
| Immigrants | Bolivia | 0.1 /100 | #272 | Tragic 96.3% |
| Immigrants | Cameroon | 0.1 /100 | #273 | Tragic 96.3% |
| Immigrants | Philippines | 0.1 /100 | #274 | Tragic 96.3% |
| Immigrants | Ghana | 0.1 /100 | #275 | Tragic 96.3% |
| Yaqui | 0.1 /100 | #276 | Tragic 96.3% |
| Immigrants | Western Africa | 0.1 /100 | #277 | Tragic 96.3% |
| Immigrants | Thailand | 0.1 /100 | #278 | Tragic 96.3% |
| Immigrants | Peru | 0.1 /100 | #279 | Tragic 96.2% |
| Immigrants | Afghanistan | 0.1 /100 | #280 | Tragic 96.2% |
Demographics Similar to Irish by 6th Grade
In terms of 6th grade, the demographic groups most similar to Irish are Scottish (98.1%, a difference of 0.010%), Polish (98.1%, a difference of 0.010%), Pennsylvania German (98.1%, a difference of 0.010%), Finnish (98.1%, a difference of 0.010%), and Inupiat (98.1%, a difference of 0.020%).
| Demographics | Rating | Rank | 6th Grade |
| Alaskan Athabascans | 100.0 /100 | #12 | Exceptional 98.1% |
| Tlingit-Haida | 100.0 /100 | #13 | Exceptional 98.1% |
| Carpatho Rusyns | 100.0 /100 | #14 | Exceptional 98.1% |
| Inupiat | 100.0 /100 | #15 | Exceptional 98.1% |
| Scottish | 100.0 /100 | #16 | Exceptional 98.1% |
| Poles | 100.0 /100 | #17 | Exceptional 98.1% |
| Pennsylvania Germans | 100.0 /100 | #18 | Exceptional 98.1% |
| Irish | 100.0 /100 | #19 | Exceptional 98.1% |
| Finns | 100.0 /100 | #20 | Exceptional 98.1% |
| Lithuanians | 100.0 /100 | #21 | Exceptional 98.1% |
| Danes | 100.0 /100 | #22 | Exceptional 98.0% |
| Sioux | 100.0 /100 | #23 | Exceptional 98.0% |
| Croatians | 100.0 /100 | #24 | Exceptional 98.0% |
| Scotch-Irish | 100.0 /100 | #25 | Exceptional 98.0% |
| Czechs | 100.0 /100 | #26 | Exceptional 98.0% |