Immigrants from Europe vs Brazilian 6th Grade
COMPARE
Immigrants from Europe
Brazilian
6th Grade
6th Grade Comparison
Immigrants from Europe
Brazilians
97.3%
6TH GRADE
91.1/ 100
METRIC RATING
131st/ 347
METRIC RANK
96.9%
6TH GRADE
20.1/ 100
METRIC RATING
197th/ 347
METRIC RANK
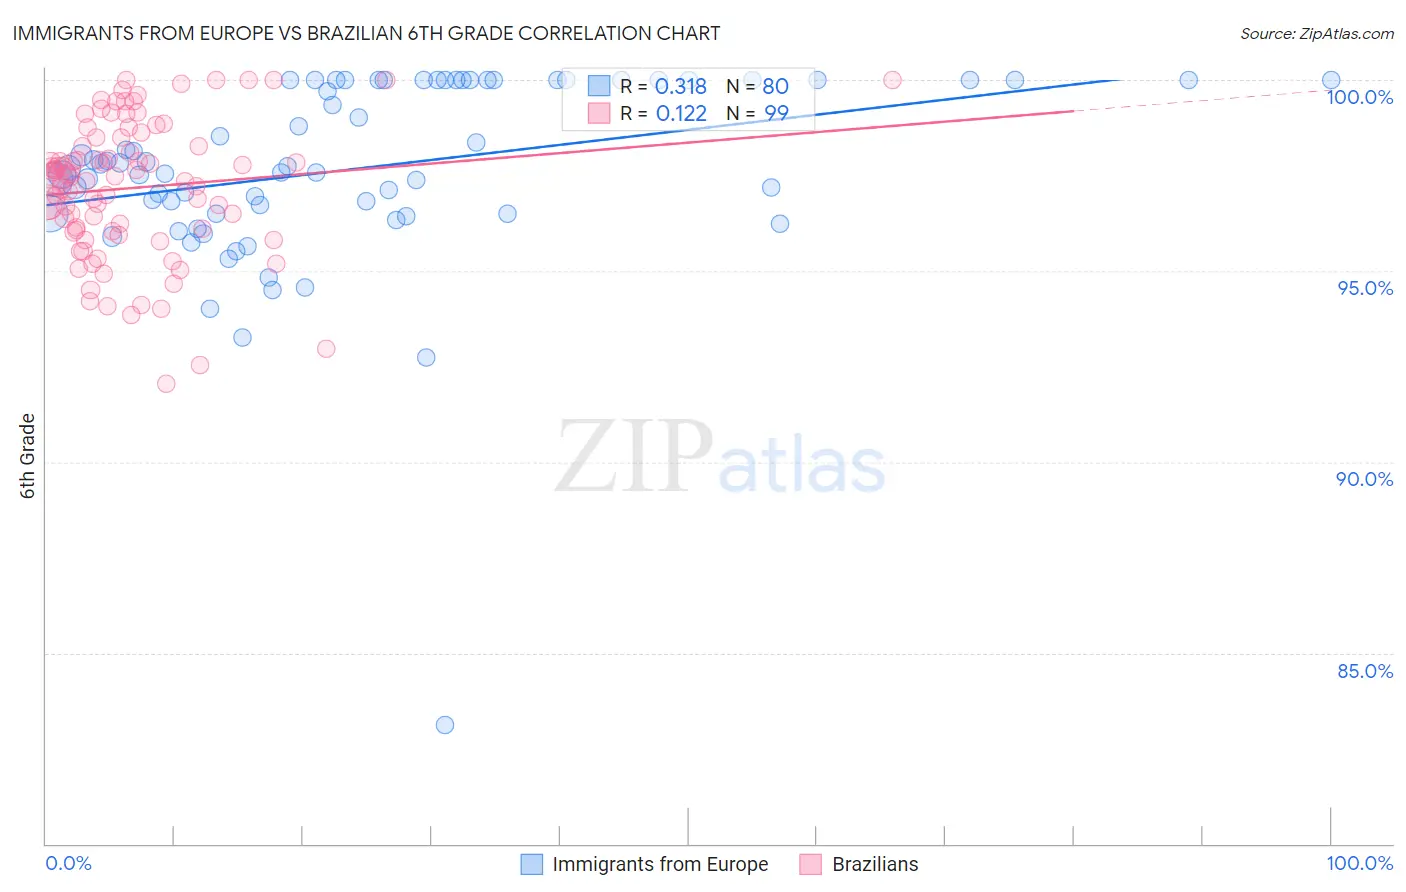
Immigrants from Europe vs Brazilian 6th Grade Correlation Chart
The statistical analysis conducted on geographies consisting of 547,425,973 people shows a mild positive correlation between the proportion of Immigrants from Europe and percentage of population with at least 6th grade education in the United States with a correlation coefficient (R) of 0.318 and weighted average of 97.3%. Similarly, the statistical analysis conducted on geographies consisting of 323,962,626 people shows a poor positive correlation between the proportion of Brazilians and percentage of population with at least 6th grade education in the United States with a correlation coefficient (R) of 0.122 and weighted average of 96.9%, a difference of 0.42%.
6th Grade Correlation Summary
| Measurement | Immigrants from Europe | Brazilian |
| Minimum | 83.1% | 92.0% |
| Maximum | 100.0% | 100.0% |
| Range | 16.9% | 8.0% |
| Mean | 97.7% | 97.2% |
| Median | 97.7% | 97.5% |
| Interquartile 25% (IQ1) | 96.5% | 96.0% |
| Interquartile 75% (IQ3) | 100.0% | 98.5% |
| Interquartile Range (IQR) | 3.5% | 2.5% |
| Standard Deviation (Sample) | 2.5% | 1.8% |
| Standard Deviation (Population) | 2.5% | 1.8% |
Similar Demographics by 6th Grade
Demographics Similar to Immigrants from Europe by 6th Grade
In terms of 6th grade, the demographic groups most similar to Immigrants from Europe are Palestinian (97.3%, a difference of 0.0%), Immigrants from Romania (97.3%, a difference of 0.010%), Immigrants from Serbia (97.3%, a difference of 0.010%), Cambodian (97.3%, a difference of 0.010%), and Immigrants from Moldova (97.3%, a difference of 0.010%).
| Demographics | Rating | Rank | 6th Grade |
| Okinawans | 94.2 /100 | #124 | Exceptional 97.4% |
| Spanish | 93.7 /100 | #125 | Exceptional 97.3% |
| Immigrants | Bulgaria | 93.6 /100 | #126 | Exceptional 97.3% |
| Immigrants | Croatia | 93.1 /100 | #127 | Exceptional 97.3% |
| Immigrants | Romania | 92.0 /100 | #128 | Exceptional 97.3% |
| Immigrants | Serbia | 91.9 /100 | #129 | Exceptional 97.3% |
| Cambodians | 91.8 /100 | #130 | Exceptional 97.3% |
| Immigrants | Europe | 91.1 /100 | #131 | Exceptional 97.3% |
| Palestinians | 90.9 /100 | #132 | Exceptional 97.3% |
| Immigrants | Moldova | 90.0 /100 | #133 | Excellent 97.3% |
| Immigrants | Kuwait | 89.5 /100 | #134 | Excellent 97.3% |
| Immigrants | Hungary | 89.5 /100 | #135 | Excellent 97.3% |
| Filipinos | 88.9 /100 | #136 | Excellent 97.3% |
| Burmese | 87.8 /100 | #137 | Excellent 97.3% |
| Blackfeet | 87.7 /100 | #138 | Excellent 97.3% |
Demographics Similar to Brazilians by 6th Grade
In terms of 6th grade, the demographic groups most similar to Brazilians are Immigrants from Uganda (96.9%, a difference of 0.010%), Immigrants from Albania (96.9%, a difference of 0.010%), Immigrants from Northern Africa (96.9%, a difference of 0.030%), Hawaiian (96.9%, a difference of 0.040%), and Paraguayan (96.9%, a difference of 0.040%).
| Demographics | Rating | Rank | 6th Grade |
| Dutch West Indians | 28.3 /100 | #190 | Fair 96.9% |
| Panamanians | 27.3 /100 | #191 | Fair 96.9% |
| Hawaiians | 27.0 /100 | #192 | Fair 96.9% |
| Paraguayans | 26.6 /100 | #193 | Fair 96.9% |
| Immigrants | Lebanon | 25.6 /100 | #194 | Fair 96.9% |
| Immigrants | Brazil | 25.5 /100 | #195 | Fair 96.9% |
| Immigrants | Uganda | 21.2 /100 | #196 | Fair 96.9% |
| Brazilians | 20.1 /100 | #197 | Fair 96.9% |
| Immigrants | Albania | 18.8 /100 | #198 | Poor 96.9% |
| Immigrants | Northern Africa | 15.7 /100 | #199 | Poor 96.9% |
| Africans | 14.8 /100 | #200 | Poor 96.9% |
| Immigrants | Zaire | 14.5 /100 | #201 | Poor 96.9% |
| Immigrants | Chile | 14.2 /100 | #202 | Poor 96.8% |
| Sudanese | 13.9 /100 | #203 | Poor 96.8% |
| Immigrants | Bahamas | 13.8 /100 | #204 | Poor 96.8% |