Immigrants from Syria vs Brazilian 6th Grade
COMPARE
Immigrants from Syria
Brazilian
6th Grade
6th Grade Comparison
Immigrants from Syria
Brazilians
96.7%
6TH GRADE
5.9/ 100
METRIC RATING
222nd/ 347
METRIC RANK
96.9%
6TH GRADE
20.1/ 100
METRIC RATING
197th/ 347
METRIC RANK
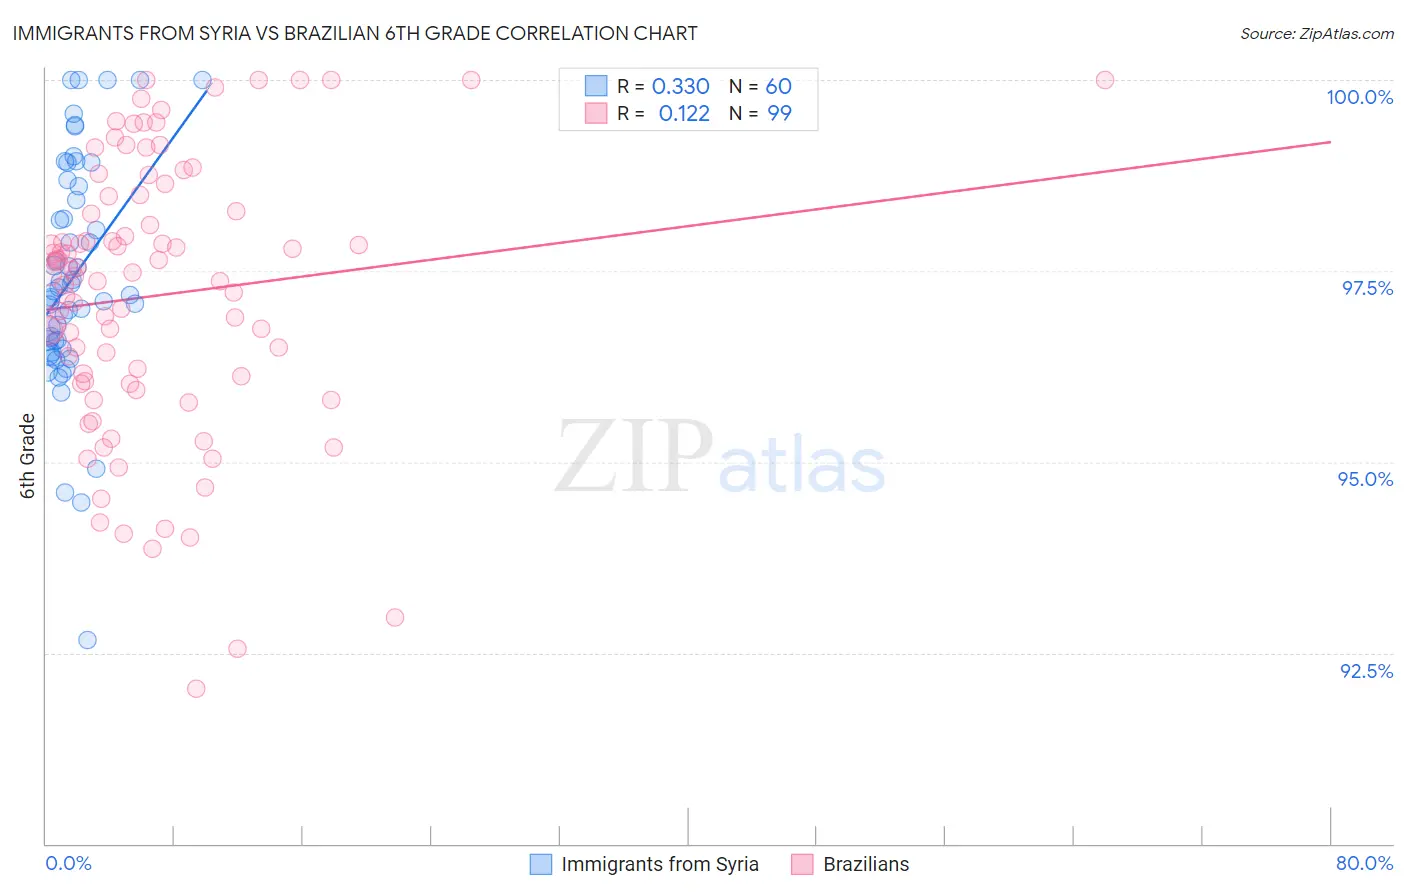
Immigrants from Syria vs Brazilian 6th Grade Correlation Chart
The statistical analysis conducted on geographies consisting of 174,108,374 people shows a mild positive correlation between the proportion of Immigrants from Syria and percentage of population with at least 6th grade education in the United States with a correlation coefficient (R) of 0.330 and weighted average of 96.7%. Similarly, the statistical analysis conducted on geographies consisting of 323,962,626 people shows a poor positive correlation between the proportion of Brazilians and percentage of population with at least 6th grade education in the United States with a correlation coefficient (R) of 0.122 and weighted average of 96.9%, a difference of 0.16%.
6th Grade Correlation Summary
| Measurement | Immigrants from Syria | Brazilian |
| Minimum | 92.7% | 92.0% |
| Maximum | 100.0% | 100.0% |
| Range | 7.3% | 8.0% |
| Mean | 97.4% | 97.2% |
| Median | 97.2% | 97.5% |
| Interquartile 25% (IQ1) | 96.5% | 96.0% |
| Interquartile 75% (IQ3) | 98.5% | 98.5% |
| Interquartile Range (IQR) | 2.0% | 2.5% |
| Standard Deviation (Sample) | 1.5% | 1.8% |
| Standard Deviation (Population) | 1.5% | 1.8% |
Similar Demographics by 6th Grade
Demographics Similar to Immigrants from Syria by 6th Grade
In terms of 6th grade, the demographic groups most similar to Immigrants from Syria are Tongan (96.7%, a difference of 0.0%), Immigrants from Morocco (96.7%, a difference of 0.010%), Costa Rican (96.8%, a difference of 0.020%), Liberian (96.8%, a difference of 0.030%), and Navajo (96.8%, a difference of 0.030%).
| Demographics | Rating | Rank | 6th Grade |
| Sierra Leoneans | 8.0 /100 | #215 | Tragic 96.8% |
| Paiute | 7.8 /100 | #216 | Tragic 96.8% |
| Liberians | 7.5 /100 | #217 | Tragic 96.8% |
| Navajo | 7.3 /100 | #218 | Tragic 96.8% |
| Costa Ricans | 6.8 /100 | #219 | Tragic 96.8% |
| Immigrants | Morocco | 6.2 /100 | #220 | Tragic 96.7% |
| Tongans | 6.1 /100 | #221 | Tragic 96.7% |
| Immigrants | Syria | 5.9 /100 | #222 | Tragic 96.7% |
| Bahamians | 4.8 /100 | #223 | Tragic 96.7% |
| Immigrants | Southern Europe | 4.4 /100 | #224 | Tragic 96.7% |
| Immigrants | Pakistan | 4.4 /100 | #225 | Tragic 96.7% |
| Immigrants | Panama | 4.2 /100 | #226 | Tragic 96.7% |
| Immigrants | Western Asia | 4.1 /100 | #227 | Tragic 96.7% |
| Immigrants | Malaysia | 4.0 /100 | #228 | Tragic 96.7% |
| Assyrians/Chaldeans/Syriacs | 4.0 /100 | #229 | Tragic 96.7% |
Demographics Similar to Brazilians by 6th Grade
In terms of 6th grade, the demographic groups most similar to Brazilians are Immigrants from Uganda (96.9%, a difference of 0.010%), Immigrants from Albania (96.9%, a difference of 0.010%), Immigrants from Northern Africa (96.9%, a difference of 0.030%), Hawaiian (96.9%, a difference of 0.040%), and Paraguayan (96.9%, a difference of 0.040%).
| Demographics | Rating | Rank | 6th Grade |
| Dutch West Indians | 28.3 /100 | #190 | Fair 96.9% |
| Panamanians | 27.3 /100 | #191 | Fair 96.9% |
| Hawaiians | 27.0 /100 | #192 | Fair 96.9% |
| Paraguayans | 26.6 /100 | #193 | Fair 96.9% |
| Immigrants | Lebanon | 25.6 /100 | #194 | Fair 96.9% |
| Immigrants | Brazil | 25.5 /100 | #195 | Fair 96.9% |
| Immigrants | Uganda | 21.2 /100 | #196 | Fair 96.9% |
| Brazilians | 20.1 /100 | #197 | Fair 96.9% |
| Immigrants | Albania | 18.8 /100 | #198 | Poor 96.9% |
| Immigrants | Northern Africa | 15.7 /100 | #199 | Poor 96.9% |
| Africans | 14.8 /100 | #200 | Poor 96.9% |
| Immigrants | Zaire | 14.5 /100 | #201 | Poor 96.9% |
| Immigrants | Chile | 14.2 /100 | #202 | Poor 96.8% |
| Sudanese | 13.9 /100 | #203 | Poor 96.8% |
| Immigrants | Bahamas | 13.8 /100 | #204 | Poor 96.8% |