Immigrants from Ethiopia vs Immigrants from North Macedonia 3rd Grade
COMPARE
Immigrants from Ethiopia
Immigrants from North Macedonia
3rd Grade
3rd Grade Comparison
Immigrants from Ethiopia
Immigrants from North Macedonia
97.3%
3RD GRADE
0.4/ 100
METRIC RATING
260th/ 347
METRIC RANK
97.8%
3RD GRADE
74.5/ 100
METRIC RATING
149th/ 347
METRIC RANK
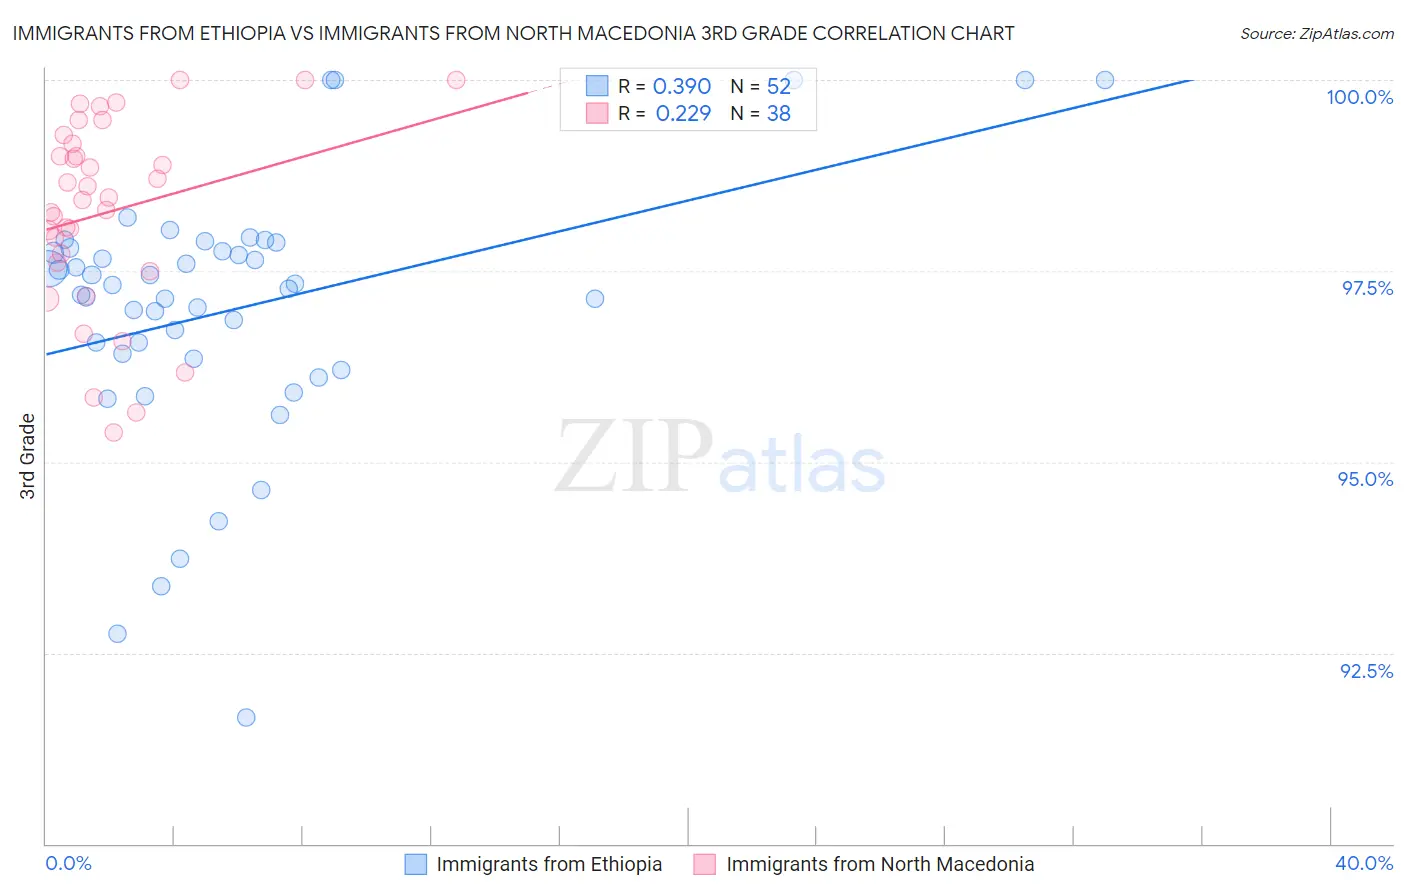
Immigrants from Ethiopia vs Immigrants from North Macedonia 3rd Grade Correlation Chart
The statistical analysis conducted on geographies consisting of 211,514,076 people shows a mild positive correlation between the proportion of Immigrants from Ethiopia and percentage of population with at least 3rd grade education in the United States with a correlation coefficient (R) of 0.390 and weighted average of 97.3%. Similarly, the statistical analysis conducted on geographies consisting of 74,317,186 people shows a weak positive correlation between the proportion of Immigrants from North Macedonia and percentage of population with at least 3rd grade education in the United States with a correlation coefficient (R) of 0.229 and weighted average of 97.8%, a difference of 0.56%.
3rd Grade Correlation Summary
| Measurement | Immigrants from Ethiopia | Immigrants from North Macedonia |
| Minimum | 91.7% | 95.4% |
| Maximum | 100.0% | 100.0% |
| Range | 8.3% | 4.6% |
| Mean | 97.0% | 98.3% |
| Median | 97.3% | 98.4% |
| Interquartile 25% (IQ1) | 96.4% | 97.6% |
| Interquartile 75% (IQ3) | 97.8% | 99.2% |
| Interquartile Range (IQR) | 1.4% | 1.5% |
| Standard Deviation (Sample) | 1.7% | 1.2% |
| Standard Deviation (Population) | 1.7% | 1.2% |
Similar Demographics by 3rd Grade
Demographics Similar to Immigrants from Ethiopia by 3rd Grade
In terms of 3rd grade, the demographic groups most similar to Immigrants from Ethiopia are Immigrants from South America (97.3%, a difference of 0.0%), Immigrants from Liberia (97.3%, a difference of 0.010%), Armenian (97.3%, a difference of 0.010%), Immigrants from Sierra Leone (97.3%, a difference of 0.010%), and Immigrants from Colombia (97.3%, a difference of 0.020%).
| Demographics | Rating | Rank | 3rd Grade |
| Immigrants | Africa | 0.8 /100 | #253 | Tragic 97.4% |
| Jamaicans | 0.7 /100 | #254 | Tragic 97.4% |
| Bolivians | 0.6 /100 | #255 | Tragic 97.3% |
| Immigrants | Congo | 0.6 /100 | #256 | Tragic 97.3% |
| Immigrants | Colombia | 0.5 /100 | #257 | Tragic 97.3% |
| Immigrants | Liberia | 0.5 /100 | #258 | Tragic 97.3% |
| Armenians | 0.4 /100 | #259 | Tragic 97.3% |
| Immigrants | Ethiopia | 0.4 /100 | #260 | Tragic 97.3% |
| Immigrants | South America | 0.4 /100 | #261 | Tragic 97.3% |
| Immigrants | Sierra Leone | 0.4 /100 | #262 | Tragic 97.3% |
| Taiwanese | 0.3 /100 | #263 | Tragic 97.3% |
| West Indians | 0.3 /100 | #264 | Tragic 97.3% |
| Immigrants | Jamaica | 0.3 /100 | #265 | Tragic 97.3% |
| Yaqui | 0.3 /100 | #266 | Tragic 97.3% |
| Immigrants | Nigeria | 0.3 /100 | #267 | Tragic 97.3% |
Demographics Similar to Immigrants from North Macedonia by 3rd Grade
In terms of 3rd grade, the demographic groups most similar to Immigrants from North Macedonia are Jordanian (97.8%, a difference of 0.0%), Immigrants from Israel (97.9%, a difference of 0.010%), Immigrants from Moldova (97.9%, a difference of 0.010%), Soviet Union (97.8%, a difference of 0.010%), and Burmese (97.9%, a difference of 0.020%).
| Demographics | Rating | Rank | 3rd Grade |
| Hmong | 80.3 /100 | #142 | Excellent 97.9% |
| Filipinos | 79.9 /100 | #143 | Good 97.9% |
| Burmese | 79.6 /100 | #144 | Good 97.9% |
| Immigrants | Greece | 79.5 /100 | #145 | Good 97.9% |
| Alsatians | 78.3 /100 | #146 | Good 97.9% |
| Immigrants | Israel | 77.3 /100 | #147 | Good 97.9% |
| Immigrants | Moldova | 77.1 /100 | #148 | Good 97.9% |
| Immigrants | North Macedonia | 74.5 /100 | #149 | Good 97.8% |
| Jordanians | 74.5 /100 | #150 | Good 97.8% |
| Soviet Union | 72.6 /100 | #151 | Good 97.8% |
| Immigrants | South Central Asia | 69.5 /100 | #152 | Good 97.8% |
| Apache | 68.5 /100 | #153 | Good 97.8% |
| Immigrants | Eastern Europe | 64.1 /100 | #154 | Good 97.8% |
| Bermudans | 62.6 /100 | #155 | Good 97.8% |
| Immigrants | Russia | 61.7 /100 | #156 | Good 97.8% |