Immigrants from Ethiopia vs Ghanaian 3rd Grade
COMPARE
Immigrants from Ethiopia
Ghanaian
3rd Grade
3rd Grade Comparison
Immigrants from Ethiopia
Ghanaians
97.3%
3RD GRADE
0.4/ 100
METRIC RATING
260th/ 347
METRIC RANK
97.2%
3RD GRADE
0.1/ 100
METRIC RATING
272nd/ 347
METRIC RANK
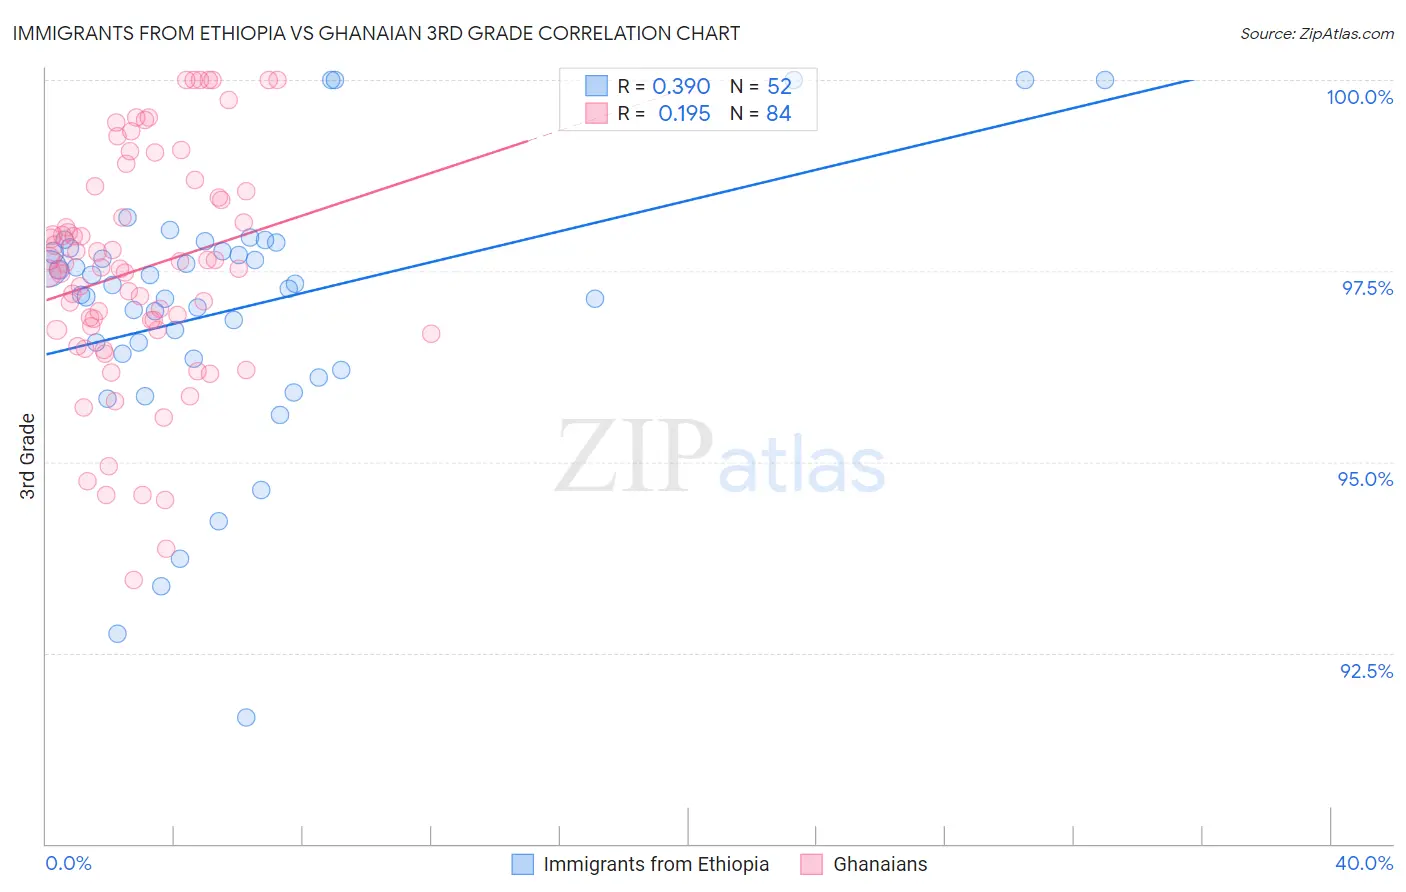
Immigrants from Ethiopia vs Ghanaian 3rd Grade Correlation Chart
The statistical analysis conducted on geographies consisting of 211,514,076 people shows a mild positive correlation between the proportion of Immigrants from Ethiopia and percentage of population with at least 3rd grade education in the United States with a correlation coefficient (R) of 0.390 and weighted average of 97.3%. Similarly, the statistical analysis conducted on geographies consisting of 190,712,873 people shows a poor positive correlation between the proportion of Ghanaians and percentage of population with at least 3rd grade education in the United States with a correlation coefficient (R) of 0.195 and weighted average of 97.2%, a difference of 0.080%.
3rd Grade Correlation Summary
| Measurement | Immigrants from Ethiopia | Ghanaian |
| Minimum | 91.7% | 93.4% |
| Maximum | 100.0% | 100.0% |
| Range | 8.3% | 6.6% |
| Mean | 97.0% | 97.5% |
| Median | 97.3% | 97.5% |
| Interquartile 25% (IQ1) | 96.4% | 96.7% |
| Interquartile 75% (IQ3) | 97.8% | 98.5% |
| Interquartile Range (IQR) | 1.4% | 1.8% |
| Standard Deviation (Sample) | 1.7% | 1.5% |
| Standard Deviation (Population) | 1.7% | 1.5% |
Demographics Similar to Immigrants from Ethiopia and Ghanaians by 3rd Grade
In terms of 3rd grade, the demographic groups most similar to Immigrants from Ethiopia are Immigrants from South America (97.3%, a difference of 0.0%), Immigrants from Liberia (97.3%, a difference of 0.010%), Armenian (97.3%, a difference of 0.010%), Immigrants from Sierra Leone (97.3%, a difference of 0.010%), and Immigrants from Colombia (97.3%, a difference of 0.020%). Similarly, the demographic groups most similar to Ghanaians are Puerto Rican (97.2%, a difference of 0.0%), Immigrants from Peru (97.2%, a difference of 0.0%), Immigrants from China (97.2%, a difference of 0.010%), Immigrants from Cameroon (97.2%, a difference of 0.010%), and Immigrants from Uzbekistan (97.2%, a difference of 0.030%).
| Demographics | Rating | Rank | 3rd Grade |
| Immigrants | Congo | 0.6 /100 | #256 | Tragic 97.3% |
| Immigrants | Colombia | 0.5 /100 | #257 | Tragic 97.3% |
| Immigrants | Liberia | 0.5 /100 | #258 | Tragic 97.3% |
| Armenians | 0.4 /100 | #259 | Tragic 97.3% |
| Immigrants | Ethiopia | 0.4 /100 | #260 | Tragic 97.3% |
| Immigrants | South America | 0.4 /100 | #261 | Tragic 97.3% |
| Immigrants | Sierra Leone | 0.4 /100 | #262 | Tragic 97.3% |
| Taiwanese | 0.3 /100 | #263 | Tragic 97.3% |
| West Indians | 0.3 /100 | #264 | Tragic 97.3% |
| Immigrants | Jamaica | 0.3 /100 | #265 | Tragic 97.3% |
| Yaqui | 0.3 /100 | #266 | Tragic 97.3% |
| Immigrants | Nigeria | 0.3 /100 | #267 | Tragic 97.3% |
| Cubans | 0.2 /100 | #268 | Tragic 97.3% |
| Fijians | 0.2 /100 | #269 | Tragic 97.3% |
| Immigrants | China | 0.2 /100 | #270 | Tragic 97.2% |
| Puerto Ricans | 0.2 /100 | #271 | Tragic 97.2% |
| Ghanaians | 0.1 /100 | #272 | Tragic 97.2% |
| Immigrants | Peru | 0.1 /100 | #273 | Tragic 97.2% |
| Immigrants | Cameroon | 0.1 /100 | #274 | Tragic 97.2% |
| Immigrants | Uzbekistan | 0.1 /100 | #275 | Tragic 97.2% |
| Immigrants | Bolivia | 0.1 /100 | #276 | Tragic 97.2% |