Immigrants from Ethiopia vs French Canadian 5th Grade
COMPARE
Immigrants from Ethiopia
French Canadian
5th Grade
5th Grade Comparison
Immigrants from Ethiopia
French Canadians
96.8%
5TH GRADE
0.5/ 100
METRIC RATING
258th/ 347
METRIC RANK
98.2%
5TH GRADE
100.0/ 100
METRIC RATING
30th/ 347
METRIC RANK
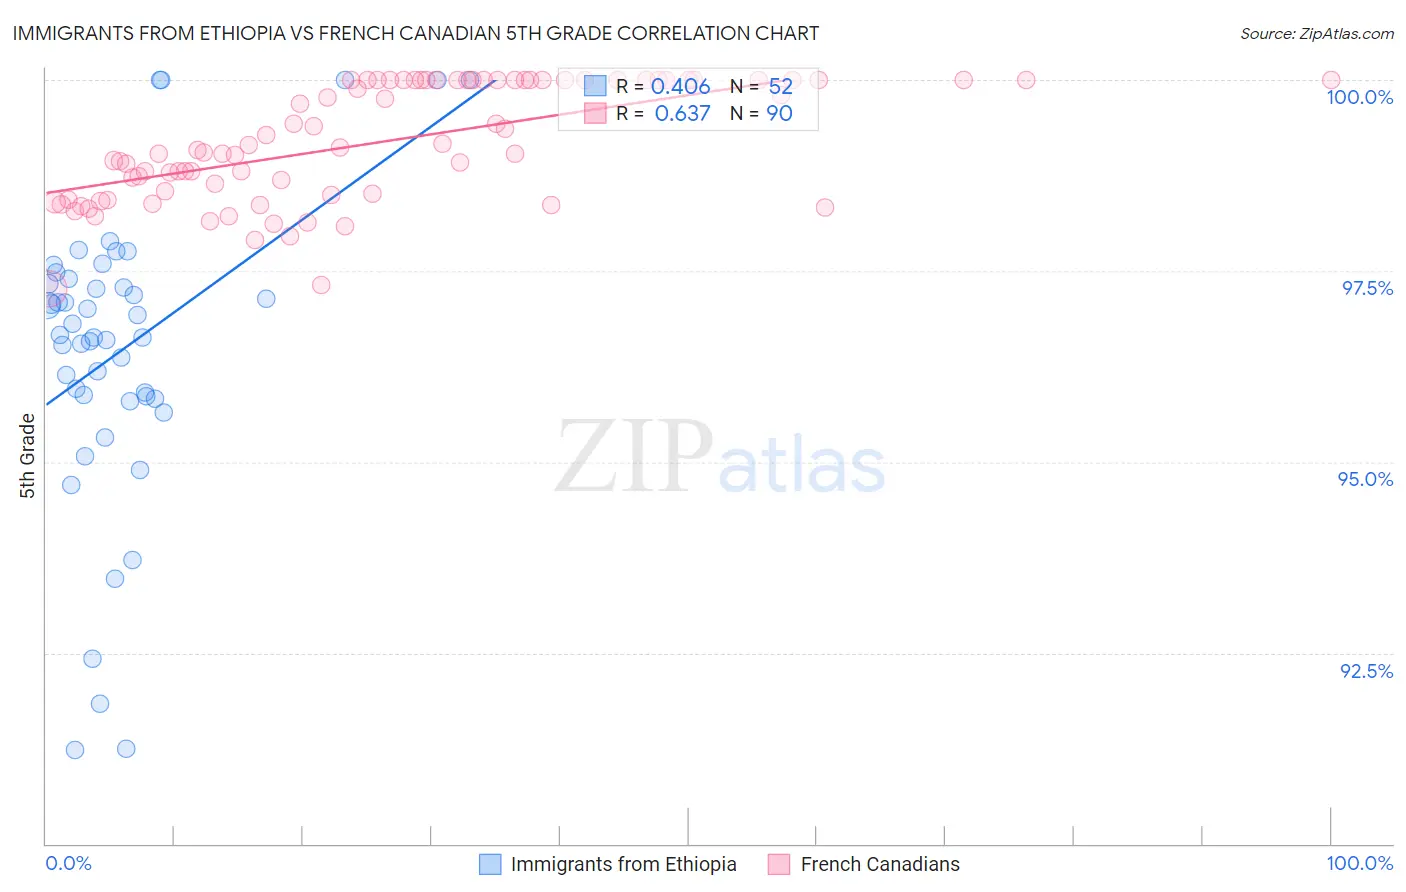
Immigrants from Ethiopia vs French Canadian 5th Grade Correlation Chart
The statistical analysis conducted on geographies consisting of 211,514,076 people shows a moderate positive correlation between the proportion of Immigrants from Ethiopia and percentage of population with at least 5th grade education in the United States with a correlation coefficient (R) of 0.406 and weighted average of 96.8%. Similarly, the statistical analysis conducted on geographies consisting of 502,680,064 people shows a significant positive correlation between the proportion of French Canadians and percentage of population with at least 5th grade education in the United States with a correlation coefficient (R) of 0.637 and weighted average of 98.2%, a difference of 1.4%.
5th Grade Correlation Summary
| Measurement | Immigrants from Ethiopia | French Canadian |
| Minimum | 91.2% | 97.3% |
| Maximum | 100.0% | 100.0% |
| Range | 8.8% | 2.7% |
| Mean | 96.5% | 99.2% |
| Median | 96.6% | 99.1% |
| Interquartile 25% (IQ1) | 95.8% | 98.5% |
| Interquartile 75% (IQ3) | 97.4% | 100.0% |
| Interquartile Range (IQR) | 1.5% | 1.5% |
| Standard Deviation (Sample) | 2.0% | 0.76% |
| Standard Deviation (Population) | 2.0% | 0.76% |
Similar Demographics by 5th Grade
Demographics Similar to Immigrants from Ethiopia by 5th Grade
In terms of 5th grade, the demographic groups most similar to Immigrants from Ethiopia are Immigrants from China (96.8%, a difference of 0.0%), Immigrants from Jamaica (96.8%, a difference of 0.020%), Immigrants from Sierra Leone (96.8%, a difference of 0.020%), Immigrants from Congo (96.8%, a difference of 0.030%), and Peruvian (96.8%, a difference of 0.030%).
| Demographics | Rating | Rank | 5th Grade |
| Bolivians | 0.9 /100 | #251 | Tragic 96.9% |
| Jamaicans | 0.9 /100 | #252 | Tragic 96.9% |
| Immigrants | Middle Africa | 0.8 /100 | #253 | Tragic 96.8% |
| Immigrants | Senegal | 0.8 /100 | #254 | Tragic 96.8% |
| South Americans | 0.7 /100 | #255 | Tragic 96.8% |
| Immigrants | Congo | 0.7 /100 | #256 | Tragic 96.8% |
| Peruvians | 0.6 /100 | #257 | Tragic 96.8% |
| Immigrants | Ethiopia | 0.5 /100 | #258 | Tragic 96.8% |
| Immigrants | China | 0.5 /100 | #259 | Tragic 96.8% |
| Immigrants | Jamaica | 0.4 /100 | #260 | Tragic 96.8% |
| Immigrants | Sierra Leone | 0.4 /100 | #261 | Tragic 96.8% |
| Immigrants | Colombia | 0.4 /100 | #262 | Tragic 96.8% |
| Immigrants | Uzbekistan | 0.3 /100 | #263 | Tragic 96.8% |
| West Indians | 0.3 /100 | #264 | Tragic 96.8% |
| Taiwanese | 0.3 /100 | #265 | Tragic 96.7% |
Demographics Similar to French Canadians by 5th Grade
In terms of 5th grade, the demographic groups most similar to French Canadians are Scandinavian (98.2%, a difference of 0.0%), European (98.2%, a difference of 0.0%), French (98.2%, a difference of 0.010%), Czech (98.2%, a difference of 0.010%), and Yup'ik (98.2%, a difference of 0.020%).
| Demographics | Rating | Rank | 5th Grade |
| Sioux | 100.0 /100 | #23 | Exceptional 98.2% |
| Scotch-Irish | 100.0 /100 | #24 | Exceptional 98.2% |
| Yup'ik | 100.0 /100 | #25 | Exceptional 98.2% |
| Alaska Natives | 100.0 /100 | #26 | Exceptional 98.2% |
| French | 100.0 /100 | #27 | Exceptional 98.2% |
| Czechs | 100.0 /100 | #28 | Exceptional 98.2% |
| Scandinavians | 100.0 /100 | #29 | Exceptional 98.2% |
| French Canadians | 100.0 /100 | #30 | Exceptional 98.2% |
| Europeans | 100.0 /100 | #31 | Exceptional 98.2% |
| Chippewa | 100.0 /100 | #32 | Exceptional 98.1% |
| Swiss | 100.0 /100 | #33 | Exceptional 98.1% |
| Chinese | 100.0 /100 | #34 | Exceptional 98.1% |
| Italians | 100.0 /100 | #35 | Exceptional 98.1% |
| British | 100.0 /100 | #36 | Exceptional 98.1% |
| Latvians | 99.9 /100 | #37 | Exceptional 98.1% |