Puerto Rican vs Immigrants from Belize 5th Grade
COMPARE
Puerto Rican
Immigrants from Belize
5th Grade
5th Grade Comparison
Puerto Ricans
Immigrants from Belize
96.1%
5TH GRADE
0.0/ 100
METRIC RATING
303rd/ 347
METRIC RANK
95.7%
5TH GRADE
0.0/ 100
METRIC RATING
321st/ 347
METRIC RANK
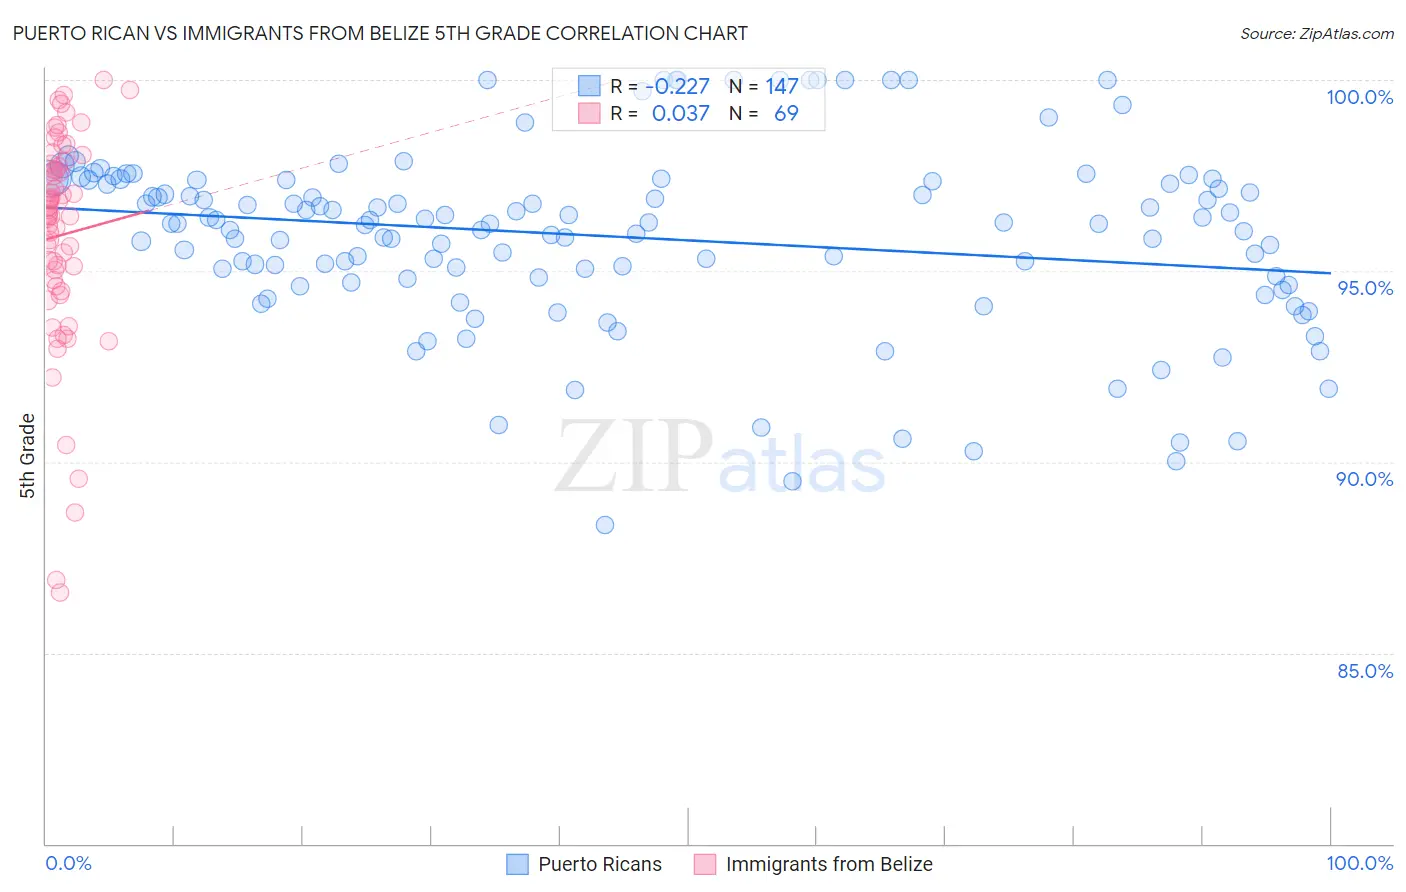
Puerto Rican vs Immigrants from Belize 5th Grade Correlation Chart
The statistical analysis conducted on geographies consisting of 528,320,438 people shows a weak negative correlation between the proportion of Puerto Ricans and percentage of population with at least 5th grade education in the United States with a correlation coefficient (R) of -0.227 and weighted average of 96.1%. Similarly, the statistical analysis conducted on geographies consisting of 130,328,311 people shows no correlation between the proportion of Immigrants from Belize and percentage of population with at least 5th grade education in the United States with a correlation coefficient (R) of 0.037 and weighted average of 95.7%, a difference of 0.45%.
5th Grade Correlation Summary
| Measurement | Puerto Rican | Immigrants from Belize |
| Minimum | 88.4% | 86.6% |
| Maximum | 100.0% | 100.0% |
| Range | 11.6% | 13.4% |
| Mean | 95.9% | 95.9% |
| Median | 96.2% | 96.5% |
| Interquartile 25% (IQ1) | 94.8% | 94.7% |
| Interquartile 75% (IQ3) | 97.4% | 97.8% |
| Interquartile Range (IQR) | 2.6% | 3.1% |
| Standard Deviation (Sample) | 2.4% | 2.8% |
| Standard Deviation (Population) | 2.4% | 2.8% |
Demographics Similar to Puerto Ricans and Immigrants from Belize by 5th Grade
In terms of 5th grade, the demographic groups most similar to Puerto Ricans are Guyanese (96.1%, a difference of 0.010%), Immigrants from Burma/Myanmar (96.1%, a difference of 0.030%), Immigrants from Laos (96.0%, a difference of 0.040%), Immigrants from Haiti (96.0%, a difference of 0.060%), and Immigrants from Caribbean (96.0%, a difference of 0.060%). Similarly, the demographic groups most similar to Immigrants from Belize are Immigrants from Nicaragua (95.6%, a difference of 0.020%), Japanese (95.7%, a difference of 0.080%), Central American Indian (95.7%, a difference of 0.080%), Immigrants from Vietnam (95.8%, a difference of 0.12%), and Belizean (95.8%, a difference of 0.15%).
| Demographics | Rating | Rank | 5th Grade |
| Guyanese | 0.0 /100 | #302 | Tragic 96.1% |
| Puerto Ricans | 0.0 /100 | #303 | Tragic 96.1% |
| Immigrants | Burma/Myanmar | 0.0 /100 | #304 | Tragic 96.1% |
| Immigrants | Laos | 0.0 /100 | #305 | Tragic 96.0% |
| Immigrants | Haiti | 0.0 /100 | #306 | Tragic 96.0% |
| Immigrants | Caribbean | 0.0 /100 | #307 | Tragic 96.0% |
| Ecuadorians | 0.0 /100 | #308 | Tragic 96.0% |
| Immigrants | Guyana | 0.0 /100 | #309 | Tragic 96.0% |
| Indonesians | 0.0 /100 | #310 | Tragic 96.0% |
| Immigrants | Bangladesh | 0.0 /100 | #311 | Tragic 96.0% |
| Vietnamese | 0.0 /100 | #312 | Tragic 95.9% |
| Bangladeshis | 0.0 /100 | #313 | Tragic 95.9% |
| Immigrants | Portugal | 0.0 /100 | #314 | Tragic 95.9% |
| Nicaraguans | 0.0 /100 | #315 | Tragic 95.9% |
| Immigrants | Ecuador | 0.0 /100 | #316 | Tragic 95.8% |
| Belizeans | 0.0 /100 | #317 | Tragic 95.8% |
| Immigrants | Vietnam | 0.0 /100 | #318 | Tragic 95.8% |
| Japanese | 0.0 /100 | #319 | Tragic 95.7% |
| Central American Indians | 0.0 /100 | #320 | Tragic 95.7% |
| Immigrants | Belize | 0.0 /100 | #321 | Tragic 95.7% |
| Immigrants | Nicaragua | 0.0 /100 | #322 | Tragic 95.6% |