German vs Immigrants from Barbados College, 1 year or more
COMPARE
German
Immigrants from Barbados
College, 1 year or more
College, 1 year or more Comparison
Germans
Immigrants from Barbados
58.9%
COLLEGE, 1 YEAR OR MORE
34.7/ 100
METRIC RATING
187th/ 347
METRIC RANK
55.4%
COLLEGE, 1 YEAR OR MORE
0.6/ 100
METRIC RATING
253rd/ 347
METRIC RANK
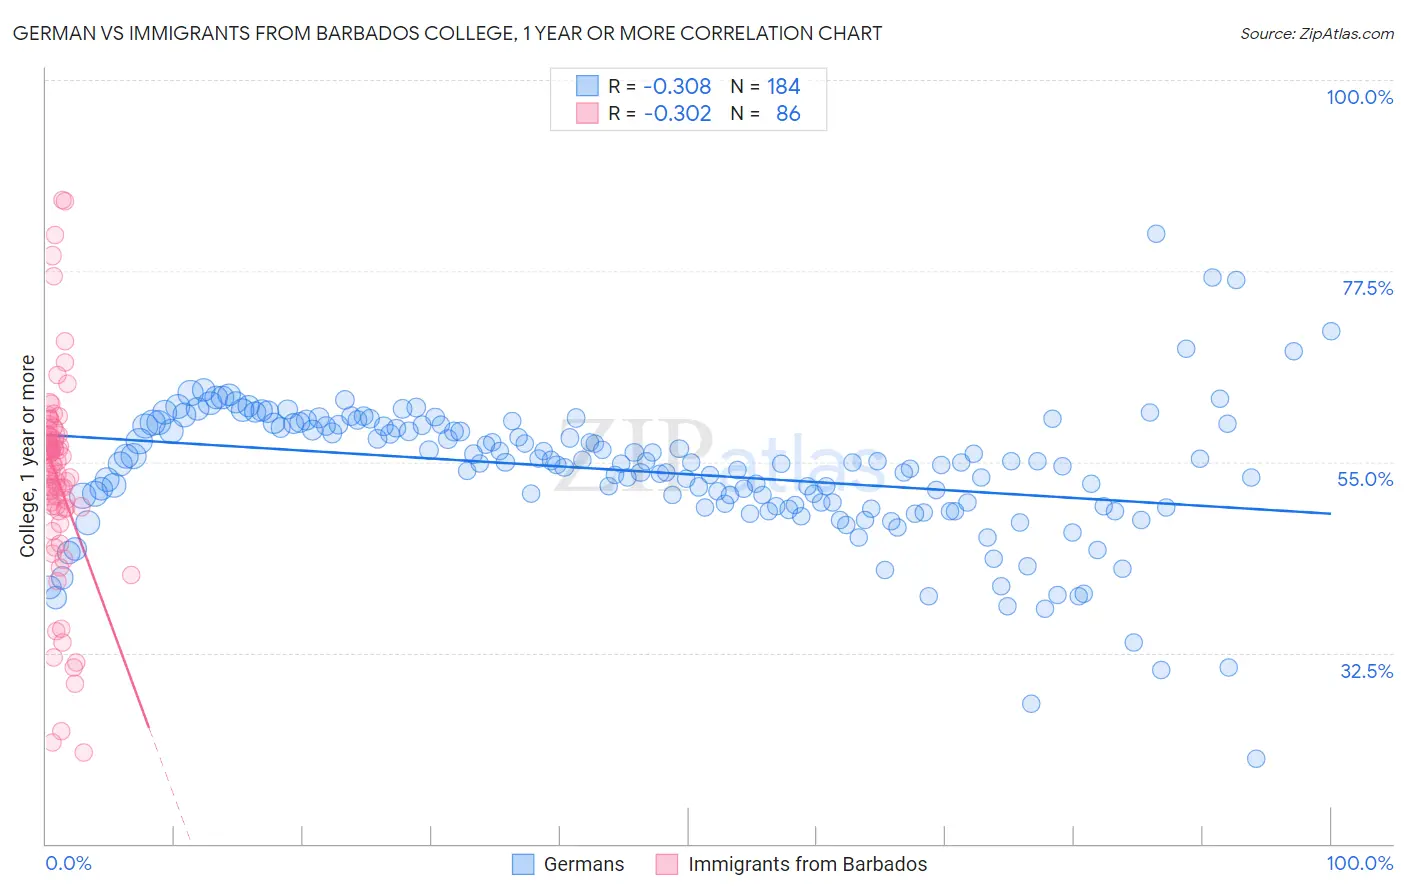
German vs Immigrants from Barbados College, 1 year or more Correlation Chart
The statistical analysis conducted on geographies consisting of 581,271,731 people shows a mild negative correlation between the proportion of Germans and percentage of population with at least college, 1 year or more education in the United States with a correlation coefficient (R) of -0.308 and weighted average of 58.9%. Similarly, the statistical analysis conducted on geographies consisting of 112,783,541 people shows a mild negative correlation between the proportion of Immigrants from Barbados and percentage of population with at least college, 1 year or more education in the United States with a correlation coefficient (R) of -0.302 and weighted average of 55.4%, a difference of 6.4%.
College, 1 year or more Correlation Summary
| Measurement | German | Immigrants from Barbados |
| Minimum | 20.0% | 20.7% |
| Maximum | 81.8% | 85.8% |
| Range | 61.8% | 65.1% |
| Mean | 53.9% | 53.0% |
| Median | 54.9% | 53.8% |
| Interquartile 25% (IQ1) | 49.8% | 49.7% |
| Interquartile 75% (IQ3) | 59.4% | 58.1% |
| Interquartile Range (IQR) | 9.6% | 8.4% |
| Standard Deviation (Sample) | 8.2% | 12.1% |
| Standard Deviation (Population) | 8.1% | 12.1% |
Similar Demographics by College, 1 year or more
Demographics Similar to Germans by College, 1 year or more
In terms of college, 1 year or more, the demographic groups most similar to Germans are Scotch-Irish (58.9%, a difference of 0.0%), French (58.9%, a difference of 0.020%), South American (59.0%, a difference of 0.070%), Uruguayan (58.8%, a difference of 0.17%), and Spaniard (59.0%, a difference of 0.21%).
| Demographics | Rating | Rank | College, 1 year or more |
| Yugoslavians | 44.1 /100 | #180 | Average 59.2% |
| Swiss | 43.4 /100 | #181 | Average 59.2% |
| Immigrants | Bosnia and Herzegovina | 42.8 /100 | #182 | Average 59.2% |
| German Russians | 39.3 /100 | #183 | Fair 59.1% |
| Spaniards | 38.3 /100 | #184 | Fair 59.0% |
| South Americans | 35.9 /100 | #185 | Fair 59.0% |
| Scotch-Irish | 34.7 /100 | #186 | Fair 58.9% |
| Germans | 34.7 /100 | #187 | Fair 58.9% |
| French | 34.4 /100 | #188 | Fair 58.9% |
| Uruguayans | 31.8 /100 | #189 | Fair 58.8% |
| Immigrants | Cameroon | 31.2 /100 | #190 | Fair 58.8% |
| Immigrants | Philippines | 29.2 /100 | #191 | Fair 58.7% |
| Colombians | 27.6 /100 | #192 | Fair 58.7% |
| Peruvians | 27.5 /100 | #193 | Fair 58.6% |
| Costa Ricans | 26.4 /100 | #194 | Fair 58.6% |
Demographics Similar to Immigrants from Barbados by College, 1 year or more
In terms of college, 1 year or more, the demographic groups most similar to Immigrants from Barbados are Aleut (55.4%, a difference of 0.11%), Immigrants from Cambodia (55.4%, a difference of 0.13%), Delaware (55.5%, a difference of 0.23%), Immigrants from Trinidad and Tobago (55.5%, a difference of 0.25%), and Japanese (55.2%, a difference of 0.25%).
| Demographics | Rating | Rank | College, 1 year or more |
| Malaysians | 0.8 /100 | #246 | Tragic 55.6% |
| Hawaiians | 0.8 /100 | #247 | Tragic 55.6% |
| Immigrants | Congo | 0.8 /100 | #248 | Tragic 55.6% |
| Immigrants | Trinidad and Tobago | 0.7 /100 | #249 | Tragic 55.5% |
| Delaware | 0.7 /100 | #250 | Tragic 55.5% |
| Immigrants | Cambodia | 0.6 /100 | #251 | Tragic 55.4% |
| Aleuts | 0.6 /100 | #252 | Tragic 55.4% |
| Immigrants | Barbados | 0.6 /100 | #253 | Tragic 55.4% |
| Japanese | 0.5 /100 | #254 | Tragic 55.2% |
| Immigrants | Bahamas | 0.5 /100 | #255 | Tragic 55.2% |
| Immigrants | West Indies | 0.5 /100 | #256 | Tragic 55.2% |
| Indonesians | 0.4 /100 | #257 | Tragic 55.1% |
| Africans | 0.4 /100 | #258 | Tragic 55.0% |
| Nepalese | 0.3 /100 | #259 | Tragic 54.9% |
| Jamaicans | 0.3 /100 | #260 | Tragic 54.9% |