Immigrants from Fiji vs French Canadian 6th Grade
COMPARE
Immigrants from Fiji
French Canadian
6th Grade
6th Grade Comparison
Immigrants from Fiji
French Canadians
95.2%
6TH GRADE
0.0/ 100
METRIC RATING
321st/ 347
METRIC RANK
98.0%
6TH GRADE
100.0/ 100
METRIC RATING
30th/ 347
METRIC RANK
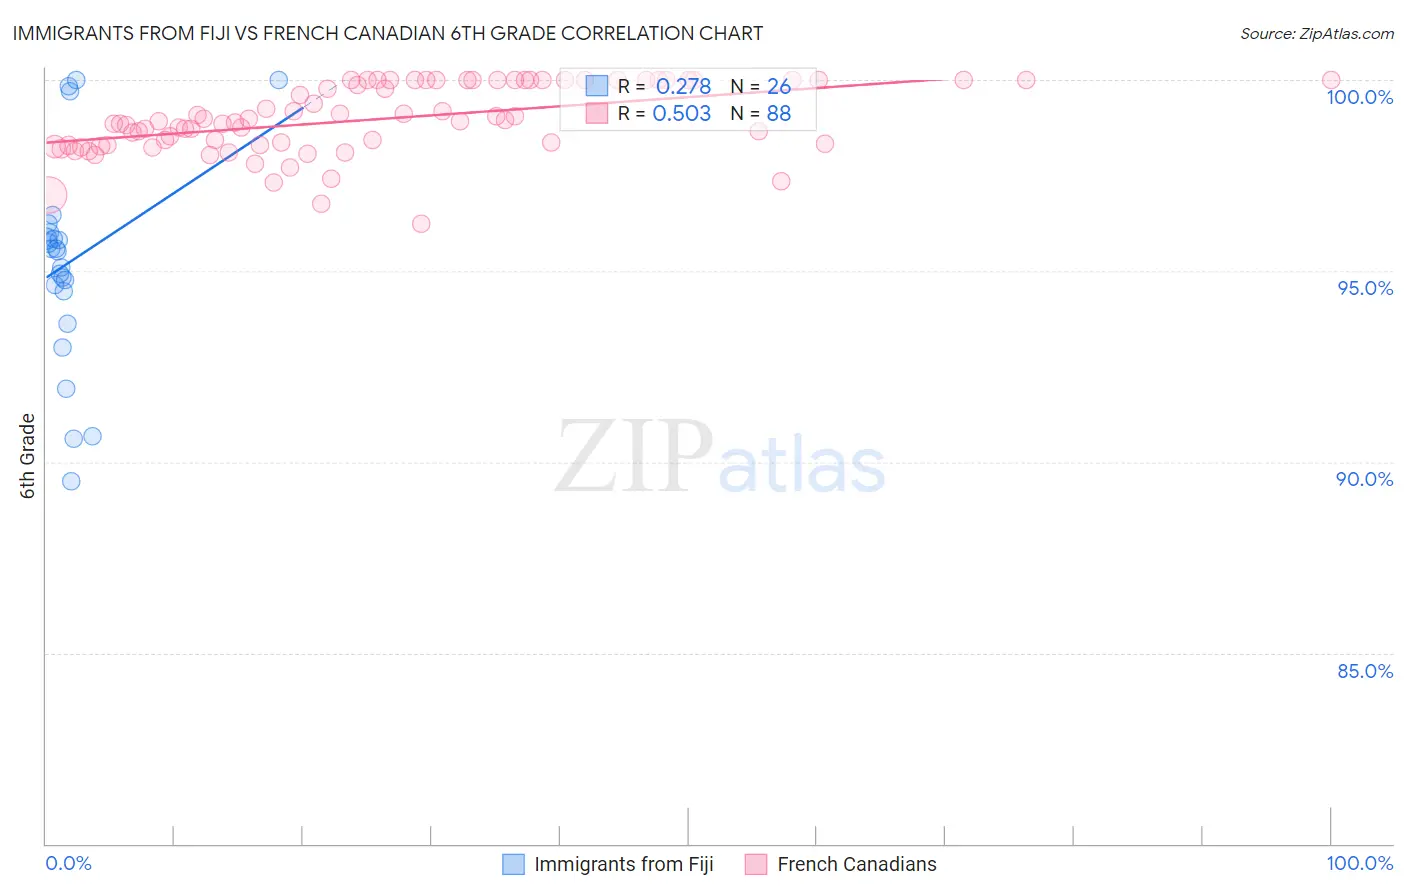
Immigrants from Fiji vs French Canadian 6th Grade Correlation Chart
The statistical analysis conducted on geographies consisting of 93,756,204 people shows a weak positive correlation between the proportion of Immigrants from Fiji and percentage of population with at least 6th grade education in the United States with a correlation coefficient (R) of 0.278 and weighted average of 95.2%. Similarly, the statistical analysis conducted on geographies consisting of 502,679,457 people shows a substantial positive correlation between the proportion of French Canadians and percentage of population with at least 6th grade education in the United States with a correlation coefficient (R) of 0.503 and weighted average of 98.0%, a difference of 2.9%.
6th Grade Correlation Summary
| Measurement | Immigrants from Fiji | French Canadian |
| Minimum | 89.5% | 96.2% |
| Maximum | 100.0% | 100.0% |
| Range | 10.5% | 3.8% |
| Mean | 95.2% | 99.0% |
| Median | 95.5% | 98.9% |
| Interquartile 25% (IQ1) | 94.5% | 98.3% |
| Interquartile 75% (IQ3) | 96.0% | 100.0% |
| Interquartile Range (IQR) | 1.6% | 1.7% |
| Standard Deviation (Sample) | 2.7% | 0.90% |
| Standard Deviation (Population) | 2.7% | 0.90% |
Similar Demographics by 6th Grade
Demographics Similar to Immigrants from Fiji by 6th Grade
In terms of 6th grade, the demographic groups most similar to Immigrants from Fiji are Immigrants from Cambodia (95.2%, a difference of 0.050%), Immigrants from Ecuador (95.3%, a difference of 0.060%), Central American Indian (95.1%, a difference of 0.060%), Cape Verdean (95.1%, a difference of 0.090%), and Immigrants from Belize (95.3%, a difference of 0.10%).
| Demographics | Rating | Rank | 6th Grade |
| Immigrants | Vietnam | 0.0 /100 | #314 | Tragic 95.4% |
| Immigrants | Bangladesh | 0.0 /100 | #315 | Tragic 95.4% |
| Japanese | 0.0 /100 | #316 | Tragic 95.4% |
| Vietnamese | 0.0 /100 | #317 | Tragic 95.3% |
| Belizeans | 0.0 /100 | #318 | Tragic 95.3% |
| Immigrants | Belize | 0.0 /100 | #319 | Tragic 95.3% |
| Immigrants | Ecuador | 0.0 /100 | #320 | Tragic 95.3% |
| Immigrants | Fiji | 0.0 /100 | #321 | Tragic 95.2% |
| Immigrants | Cambodia | 0.0 /100 | #322 | Tragic 95.2% |
| Central American Indians | 0.0 /100 | #323 | Tragic 95.1% |
| Cape Verdeans | 0.0 /100 | #324 | Tragic 95.1% |
| Immigrants | Nicaragua | 0.0 /100 | #325 | Tragic 95.1% |
| Hispanics or Latinos | 0.0 /100 | #326 | Tragic 95.0% |
| Mexican American Indians | 0.0 /100 | #327 | Tragic 95.0% |
| Hondurans | 0.0 /100 | #328 | Tragic 95.0% |
Demographics Similar to French Canadians by 6th Grade
In terms of 6th grade, the demographic groups most similar to French Canadians are European (98.0%, a difference of 0.0%), Yup'ik (98.0%, a difference of 0.010%), Scandinavian (98.0%, a difference of 0.010%), French (98.0%, a difference of 0.010%), and Alaska Native (98.0%, a difference of 0.010%).
| Demographics | Rating | Rank | 6th Grade |
| Sioux | 100.0 /100 | #23 | Exceptional 98.0% |
| Croatians | 100.0 /100 | #24 | Exceptional 98.0% |
| Scotch-Irish | 100.0 /100 | #25 | Exceptional 98.0% |
| Czechs | 100.0 /100 | #26 | Exceptional 98.0% |
| Yup'ik | 100.0 /100 | #27 | Exceptional 98.0% |
| Scandinavians | 100.0 /100 | #28 | Exceptional 98.0% |
| French | 100.0 /100 | #29 | Exceptional 98.0% |
| French Canadians | 100.0 /100 | #30 | Exceptional 98.0% |
| Europeans | 100.0 /100 | #31 | Exceptional 98.0% |
| Alaska Natives | 100.0 /100 | #32 | Exceptional 98.0% |
| Chippewa | 100.0 /100 | #33 | Exceptional 97.9% |
| Swiss | 100.0 /100 | #34 | Exceptional 97.9% |
| Chinese | 100.0 /100 | #35 | Exceptional 97.9% |
| Italians | 100.0 /100 | #36 | Exceptional 97.9% |
| British | 100.0 /100 | #37 | Exceptional 97.9% |