Immigrants from Eritrea vs Immigrants from England No Schooling Completed
COMPARE
Immigrants from Eritrea
Immigrants from England
No Schooling Completed
No Schooling Completed Comparison
Immigrants from Eritrea
Immigrants from England
2.8%
NO SCHOOLING COMPLETED
0.0/ 100
METRIC RATING
294th/ 347
METRIC RANK
1.7%
NO SCHOOLING COMPLETED
99.5/ 100
METRIC RATING
71st/ 347
METRIC RANK
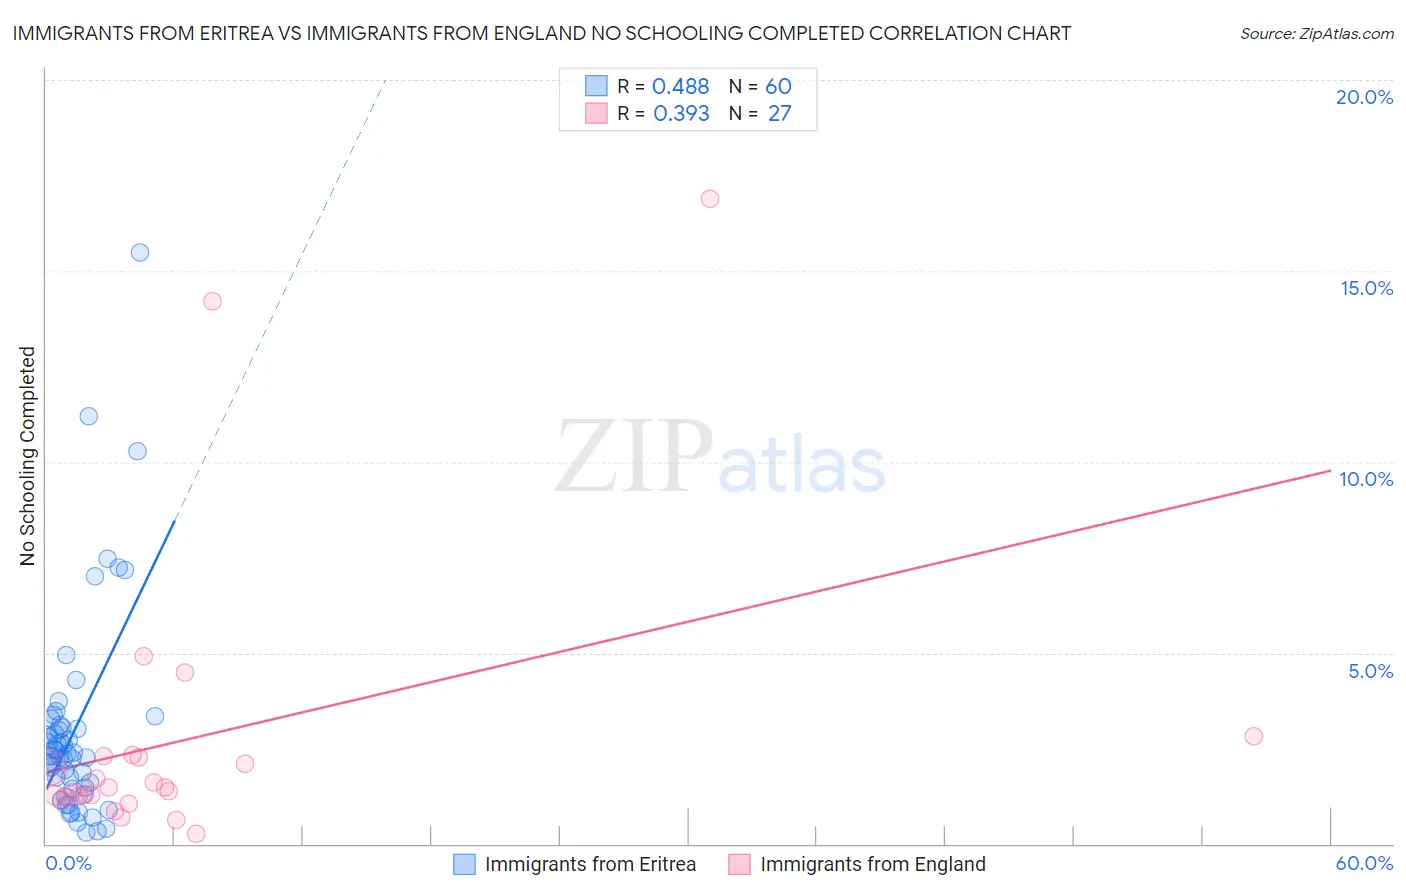
Immigrants from Eritrea vs Immigrants from England No Schooling Completed Correlation Chart
The statistical analysis conducted on geographies consisting of 104,735,376 people shows a moderate positive correlation between the proportion of Immigrants from Eritrea and percentage of population with no schooling in the United States with a correlation coefficient (R) of 0.488 and weighted average of 2.8%. Similarly, the statistical analysis conducted on geographies consisting of 387,063,522 people shows a mild positive correlation between the proportion of Immigrants from England and percentage of population with no schooling in the United States with a correlation coefficient (R) of 0.393 and weighted average of 1.7%, a difference of 61.5%.
No Schooling Completed Correlation Summary
| Measurement | Immigrants from Eritrea | Immigrants from England |
| Minimum | 0.30% | 0.25% |
| Maximum | 15.5% | 16.9% |
| Range | 15.2% | 16.7% |
| Mean | 3.0% | 2.7% |
| Median | 2.3% | 1.5% |
| Interquartile 25% (IQ1) | 1.4% | 1.2% |
| Interquartile 75% (IQ3) | 3.1% | 2.3% |
| Interquartile Range (IQR) | 1.6% | 1.1% |
| Standard Deviation (Sample) | 2.7% | 3.8% |
| Standard Deviation (Population) | 2.7% | 3.8% |
Similar Demographics by No Schooling Completed
Demographics Similar to Immigrants from Eritrea by No Schooling Completed
In terms of no schooling completed, the demographic groups most similar to Immigrants from Eritrea are Malaysian (2.8%, a difference of 0.17%), Houma (2.8%, a difference of 0.52%), Immigrants from Grenada (2.8%, a difference of 0.58%), Immigrants (2.8%, a difference of 0.62%), and British West Indian (2.7%, a difference of 1.6%).
| Demographics | Rating | Rank | No Schooling Completed |
| Immigrants | Afghanistan | 0.0 /100 | #287 | Tragic 2.7% |
| Immigrants | St. Vincent and the Grenadines | 0.0 /100 | #288 | Tragic 2.7% |
| Immigrants | Thailand | 0.0 /100 | #289 | Tragic 2.7% |
| Immigrants | Hong Kong | 0.0 /100 | #290 | Tragic 2.7% |
| British West Indians | 0.0 /100 | #291 | Tragic 2.7% |
| Immigrants | Grenada | 0.0 /100 | #292 | Tragic 2.8% |
| Malaysians | 0.0 /100 | #293 | Tragic 2.8% |
| Immigrants | Eritrea | 0.0 /100 | #294 | Tragic 2.8% |
| Houma | 0.0 /100 | #295 | Tragic 2.8% |
| Immigrants | Immigrants | 0.0 /100 | #296 | Tragic 2.8% |
| Immigrants | Cuba | 0.0 /100 | #297 | Tragic 2.8% |
| Immigrants | Dominica | 0.0 /100 | #298 | Tragic 2.8% |
| Central American Indians | 0.0 /100 | #299 | Tragic 2.8% |
| Haitians | 0.0 /100 | #300 | Tragic 2.9% |
| Immigrants | South Eastern Asia | 0.0 /100 | #301 | Tragic 2.9% |
Demographics Similar to Immigrants from England by No Schooling Completed
In terms of no schooling completed, the demographic groups most similar to Immigrants from England are Cajun (1.7%, a difference of 0.17%), Immigrants from Netherlands (1.7%, a difference of 0.34%), Immigrants from India (1.7%, a difference of 0.65%), Zimbabwean (1.7%, a difference of 0.68%), and Immigrants from Belgium (1.7%, a difference of 1.3%).
| Demographics | Rating | Rank | No Schooling Completed |
| New Zealanders | 99.7 /100 | #64 | Exceptional 1.7% |
| Serbians | 99.7 /100 | #65 | Exceptional 1.7% |
| Canadians | 99.7 /100 | #66 | Exceptional 1.7% |
| Immigrants | Austria | 99.7 /100 | #67 | Exceptional 1.7% |
| Immigrants | Lithuania | 99.7 /100 | #68 | Exceptional 1.7% |
| Chickasaw | 99.6 /100 | #69 | Exceptional 1.7% |
| Immigrants | Netherlands | 99.6 /100 | #70 | Exceptional 1.7% |
| Immigrants | England | 99.5 /100 | #71 | Exceptional 1.7% |
| Cajuns | 99.5 /100 | #72 | Exceptional 1.7% |
| Immigrants | India | 99.4 /100 | #73 | Exceptional 1.7% |
| Zimbabweans | 99.4 /100 | #74 | Exceptional 1.7% |
| Immigrants | Belgium | 99.3 /100 | #75 | Exceptional 1.7% |
| Cherokee | 99.3 /100 | #76 | Exceptional 1.7% |
| Immigrants | Sweden | 99.3 /100 | #77 | Exceptional 1.7% |
| Delaware | 99.3 /100 | #78 | Exceptional 1.7% |