Immigrants from Sierra Leone vs Immigrants from Afghanistan 6th Grade
COMPARE
Immigrants from Sierra Leone
Immigrants from Afghanistan
6th Grade
6th Grade Comparison
Immigrants from Sierra Leone
Immigrants from Afghanistan
96.4%
6TH GRADE
0.4/ 100
METRIC RATING
261st/ 347
METRIC RANK
96.2%
6TH GRADE
0.1/ 100
METRIC RATING
280th/ 347
METRIC RANK
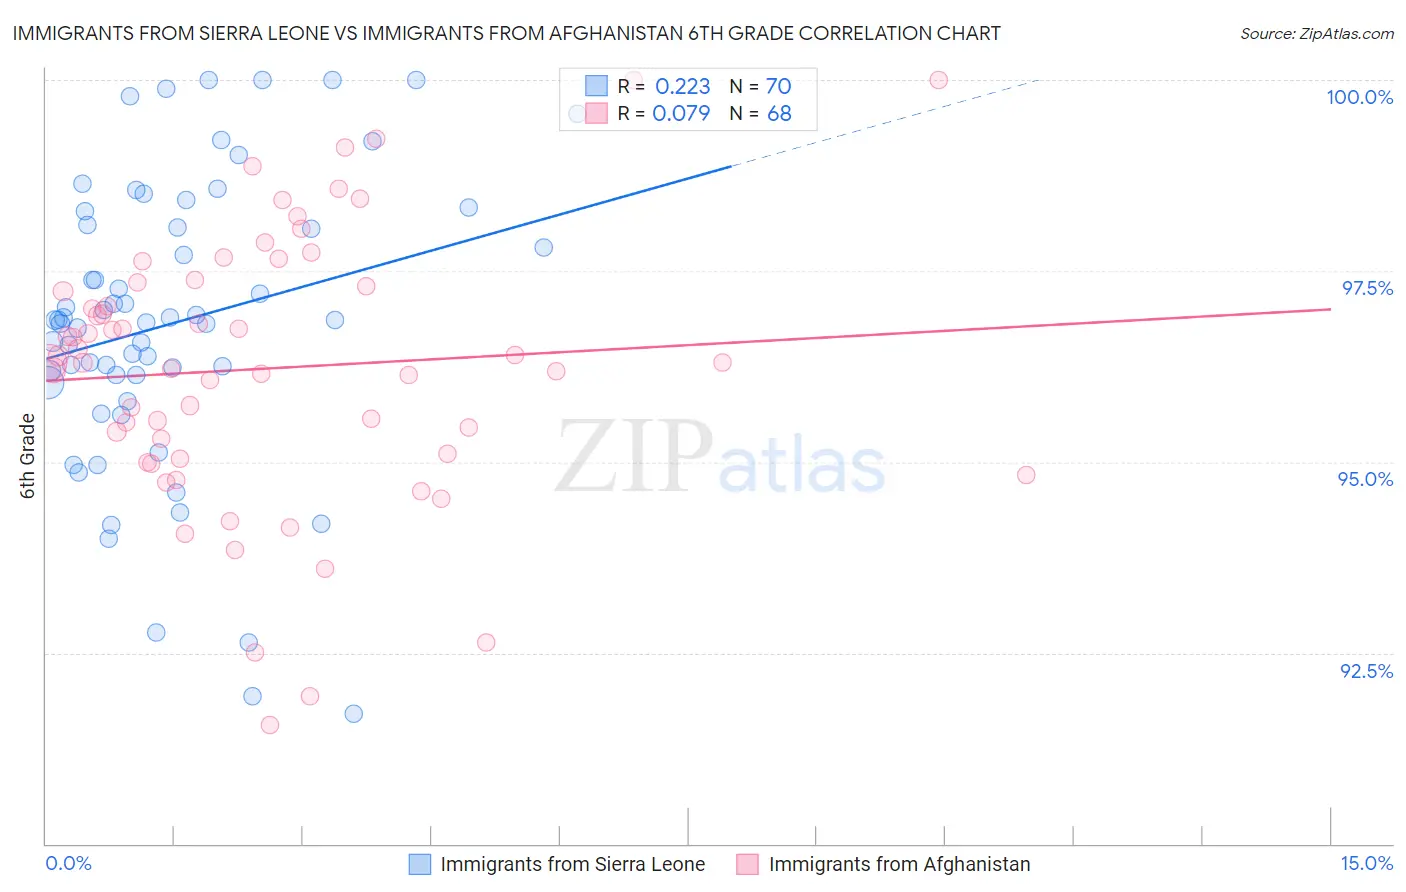
Immigrants from Sierra Leone vs Immigrants from Afghanistan 6th Grade Correlation Chart
The statistical analysis conducted on geographies consisting of 101,634,956 people shows a weak positive correlation between the proportion of Immigrants from Sierra Leone and percentage of population with at least 6th grade education in the United States with a correlation coefficient (R) of 0.223 and weighted average of 96.4%. Similarly, the statistical analysis conducted on geographies consisting of 147,629,924 people shows a slight positive correlation between the proportion of Immigrants from Afghanistan and percentage of population with at least 6th grade education in the United States with a correlation coefficient (R) of 0.079 and weighted average of 96.2%, a difference of 0.20%.
6th Grade Correlation Summary
| Measurement | Immigrants from Sierra Leone | Immigrants from Afghanistan |
| Minimum | 91.7% | 91.6% |
| Maximum | 100.0% | 100.0% |
| Range | 8.3% | 8.4% |
| Mean | 96.8% | 96.2% |
| Median | 96.9% | 96.3% |
| Interquartile 25% (IQ1) | 96.1% | 95.1% |
| Interquartile 75% (IQ3) | 98.1% | 97.3% |
| Interquartile Range (IQR) | 2.0% | 2.2% |
| Standard Deviation (Sample) | 1.9% | 1.8% |
| Standard Deviation (Population) | 1.9% | 1.8% |
Demographics Similar to Immigrants from Sierra Leone and Immigrants from Afghanistan by 6th Grade
In terms of 6th grade, the demographic groups most similar to Immigrants from Sierra Leone are Peruvian (96.4%, a difference of 0.010%), Immigrants from Nigeria (96.4%, a difference of 0.040%), Immigrants from Colombia (96.4%, a difference of 0.050%), Armenian (96.4%, a difference of 0.050%), and Immigrants from Jamaica (96.4%, a difference of 0.060%). Similarly, the demographic groups most similar to Immigrants from Afghanistan are Immigrants from Peru (96.2%, a difference of 0.0%), Immigrants from Western Africa (96.3%, a difference of 0.020%), Immigrants from Thailand (96.3%, a difference of 0.020%), Yaqui (96.3%, a difference of 0.030%), and Immigrants from Ghana (96.3%, a difference of 0.040%).
| Demographics | Rating | Rank | 6th Grade |
| Peruvians | 0.4 /100 | #260 | Tragic 96.4% |
| Immigrants | Sierra Leone | 0.4 /100 | #261 | Tragic 96.4% |
| Immigrants | Nigeria | 0.3 /100 | #262 | Tragic 96.4% |
| Immigrants | Colombia | 0.3 /100 | #263 | Tragic 96.4% |
| Armenians | 0.3 /100 | #264 | Tragic 96.4% |
| Immigrants | Jamaica | 0.2 /100 | #265 | Tragic 96.4% |
| Ghanaians | 0.2 /100 | #266 | Tragic 96.4% |
| Afghans | 0.2 /100 | #267 | Tragic 96.4% |
| Immigrants | Uzbekistan | 0.2 /100 | #268 | Tragic 96.3% |
| West Indians | 0.2 /100 | #269 | Tragic 96.3% |
| Immigrants | South America | 0.2 /100 | #270 | Tragic 96.3% |
| Immigrants | Hong Kong | 0.2 /100 | #271 | Tragic 96.3% |
| Immigrants | Bolivia | 0.1 /100 | #272 | Tragic 96.3% |
| Immigrants | Cameroon | 0.1 /100 | #273 | Tragic 96.3% |
| Immigrants | Philippines | 0.1 /100 | #274 | Tragic 96.3% |
| Immigrants | Ghana | 0.1 /100 | #275 | Tragic 96.3% |
| Yaqui | 0.1 /100 | #276 | Tragic 96.3% |
| Immigrants | Western Africa | 0.1 /100 | #277 | Tragic 96.3% |
| Immigrants | Thailand | 0.1 /100 | #278 | Tragic 96.3% |
| Immigrants | Peru | 0.1 /100 | #279 | Tragic 96.2% |
| Immigrants | Afghanistan | 0.1 /100 | #280 | Tragic 96.2% |