Immigrants from El Salvador vs Egyptian 1st Grade
COMPARE
Immigrants from El Salvador
Egyptian
1st Grade
1st Grade Comparison
Immigrants from El Salvador
Egyptians
96.1%
1ST GRADE
0.0/ 100
METRIC RATING
345th/ 347
METRIC RANK
97.9%
1ST GRADE
42.7/ 100
METRIC RATING
182nd/ 347
METRIC RANK
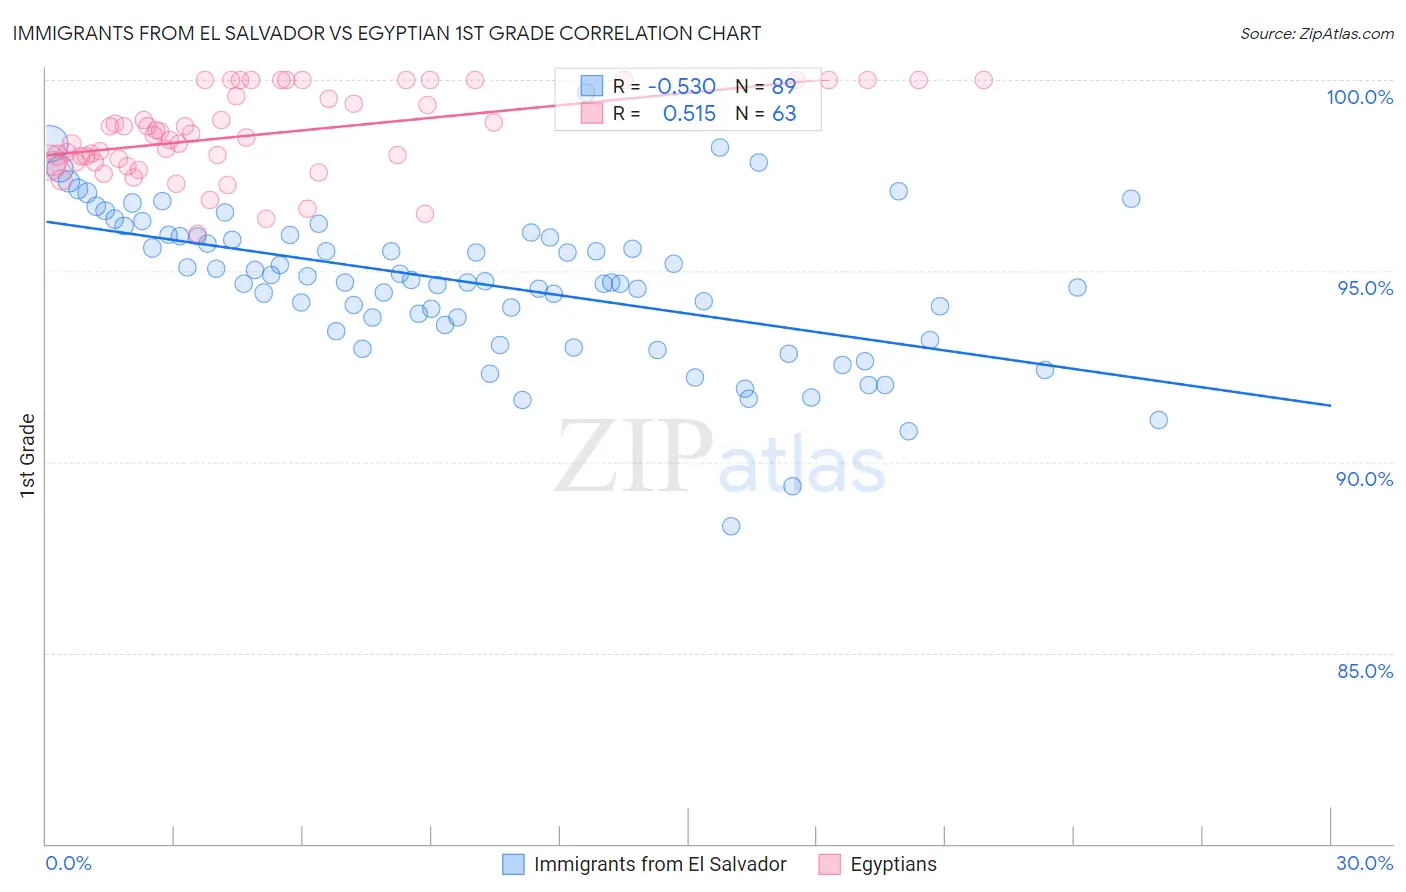
Immigrants from El Salvador vs Egyptian 1st Grade Correlation Chart
The statistical analysis conducted on geographies consisting of 357,698,489 people shows a substantial negative correlation between the proportion of Immigrants from El Salvador and percentage of population with at least 1st grade education in the United States with a correlation coefficient (R) of -0.530 and weighted average of 96.1%. Similarly, the statistical analysis conducted on geographies consisting of 276,927,519 people shows a substantial positive correlation between the proportion of Egyptians and percentage of population with at least 1st grade education in the United States with a correlation coefficient (R) of 0.515 and weighted average of 97.9%, a difference of 1.8%.
1st Grade Correlation Summary
| Measurement | Immigrants from El Salvador | Egyptian |
| Minimum | 88.3% | 96.0% |
| Maximum | 99.7% | 100.0% |
| Range | 11.4% | 4.0% |
| Mean | 94.7% | 98.6% |
| Median | 94.7% | 98.6% |
| Interquartile 25% (IQ1) | 93.5% | 97.8% |
| Interquartile 75% (IQ3) | 95.9% | 100.0% |
| Interquartile Range (IQR) | 2.4% | 2.2% |
| Standard Deviation (Sample) | 2.0% | 1.1% |
| Standard Deviation (Population) | 2.0% | 1.1% |
Similar Demographics by 1st Grade
Demographics Similar to Immigrants from El Salvador by 1st Grade
In terms of 1st grade, the demographic groups most similar to Immigrants from El Salvador are Nepalese (96.1%, a difference of 0.030%), Salvadoran (96.3%, a difference of 0.16%), Immigrants from Mexico (96.3%, a difference of 0.19%), Immigrants from Central America (96.3%, a difference of 0.22%), and Immigrants from Cabo Verde (96.3%, a difference of 0.24%).
| Demographics | Rating | Rank | 1st Grade |
| Immigrants | Dominican Republic | 0.0 /100 | #333 | Tragic 96.5% |
| Bangladeshis | 0.0 /100 | #334 | Tragic 96.5% |
| Yakama | 0.0 /100 | #335 | Tragic 96.5% |
| Guatemalans | 0.0 /100 | #336 | Tragic 96.5% |
| Immigrants | Cambodia | 0.0 /100 | #337 | Tragic 96.5% |
| Immigrants | Fiji | 0.0 /100 | #338 | Tragic 96.4% |
| Immigrants | Guatemala | 0.0 /100 | #339 | Tragic 96.4% |
| Immigrants | Cabo Verde | 0.0 /100 | #340 | Tragic 96.3% |
| Immigrants | Central America | 0.0 /100 | #341 | Tragic 96.3% |
| Immigrants | Mexico | 0.0 /100 | #342 | Tragic 96.3% |
| Salvadorans | 0.0 /100 | #343 | Tragic 96.3% |
| Nepalese | 0.0 /100 | #344 | Tragic 96.1% |
| Immigrants | El Salvador | 0.0 /100 | #345 | Tragic 96.1% |
| Immigrants | Yemen | 0.0 /100 | #346 | Tragic 95.8% |
| Spanish American Indians | 0.0 /100 | #347 | Tragic 95.7% |
Demographics Similar to Egyptians by 1st Grade
In terms of 1st grade, the demographic groups most similar to Egyptians are Portuguese (97.9%, a difference of 0.0%), Immigrants from Argentina (97.9%, a difference of 0.0%), Argentinean (97.9%, a difference of 0.010%), Immigrants from Bosnia and Herzegovina (97.9%, a difference of 0.010%), and Immigrants from Poland (97.9%, a difference of 0.010%).
| Demographics | Rating | Rank | 1st Grade |
| Immigrants | Sri Lanka | 49.7 /100 | #175 | Average 97.9% |
| Albanians | 49.6 /100 | #176 | Average 97.9% |
| Immigrants | Brazil | 49.1 /100 | #177 | Average 97.9% |
| Immigrants | Venezuela | 47.8 /100 | #178 | Average 97.9% |
| Argentineans | 47.2 /100 | #179 | Average 97.9% |
| Immigrants | Bosnia and Herzegovina | 46.6 /100 | #180 | Average 97.9% |
| Portuguese | 44.2 /100 | #181 | Average 97.9% |
| Egyptians | 42.7 /100 | #182 | Average 97.9% |
| Immigrants | Argentina | 41.3 /100 | #183 | Average 97.9% |
| Immigrants | Poland | 40.1 /100 | #184 | Average 97.9% |
| Immigrants | Belarus | 39.3 /100 | #185 | Fair 97.9% |
| Paiute | 36.5 /100 | #186 | Fair 97.9% |
| Pakistanis | 35.8 /100 | #187 | Fair 97.9% |
| Arabs | 35.5 /100 | #188 | Fair 97.9% |
| Immigrants | Kazakhstan | 34.9 /100 | #189 | Fair 97.9% |