Immigrants vs Nigerian 1st Grade
COMPARE
Immigrants
Nigerian
1st Grade
1st Grade Comparison
Immigrants
Nigerians
97.2%
1ST GRADE
0.0/ 100
METRIC RATING
295th/ 347
METRIC RANK
97.6%
1ST GRADE
1.8/ 100
METRIC RATING
238th/ 347
METRIC RANK
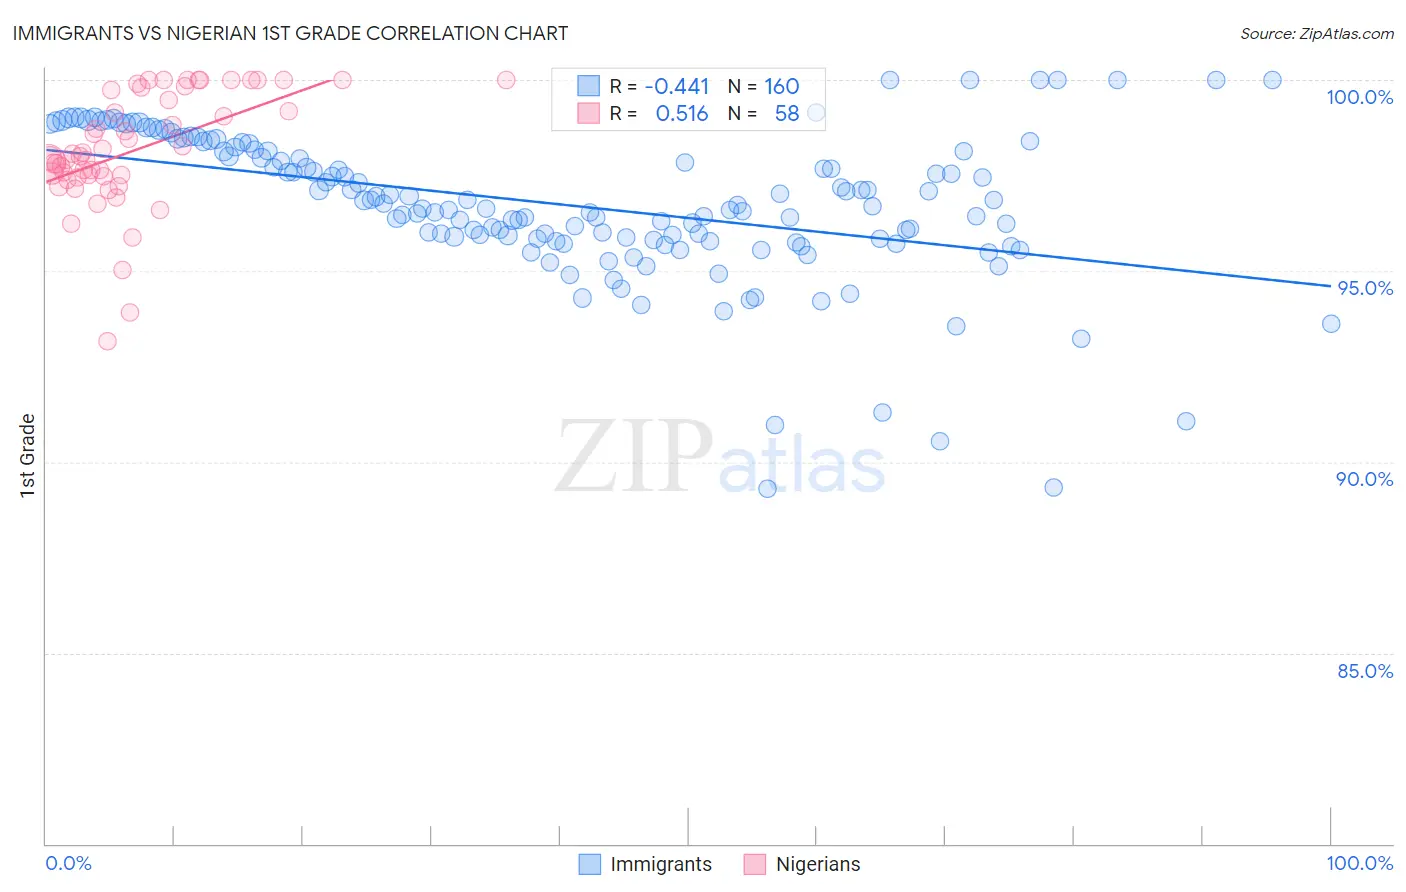
Immigrants vs Nigerian 1st Grade Correlation Chart
The statistical analysis conducted on geographies consisting of 577,788,049 people shows a moderate negative correlation between the proportion of Immigrants and percentage of population with at least 1st grade education in the United States with a correlation coefficient (R) of -0.441 and weighted average of 97.2%. Similarly, the statistical analysis conducted on geographies consisting of 332,724,627 people shows a substantial positive correlation between the proportion of Nigerians and percentage of population with at least 1st grade education in the United States with a correlation coefficient (R) of 0.516 and weighted average of 97.6%, a difference of 0.46%.
1st Grade Correlation Summary
| Measurement | Immigrants | Nigerian |
| Minimum | 89.3% | 93.1% |
| Maximum | 100.0% | 100.0% |
| Range | 10.7% | 6.9% |
| Mean | 96.7% | 98.2% |
| Median | 96.7% | 98.0% |
| Interquartile 25% (IQ1) | 95.8% | 97.5% |
| Interquartile 75% (IQ3) | 98.2% | 99.7% |
| Interquartile Range (IQR) | 2.3% | 2.3% |
| Standard Deviation (Sample) | 2.0% | 1.5% |
| Standard Deviation (Population) | 2.0% | 1.5% |
Similar Demographics by 1st Grade
Demographics Similar to Immigrants by 1st Grade
In terms of 1st grade, the demographic groups most similar to Immigrants are Immigrants from Eritrea (97.2%, a difference of 0.0%), Immigrants from Grenada (97.2%, a difference of 0.010%), Malaysian (97.2%, a difference of 0.030%), British West Indian (97.2%, a difference of 0.050%), and Central American Indian (97.1%, a difference of 0.050%).
| Demographics | Rating | Rank | 1st Grade |
| Immigrants | Thailand | 0.0 /100 | #288 | Tragic 97.3% |
| Immigrants | Afghanistan | 0.0 /100 | #289 | Tragic 97.3% |
| Immigrants | St. Vincent and the Grenadines | 0.0 /100 | #290 | Tragic 97.3% |
| Houma | 0.0 /100 | #291 | Tragic 97.2% |
| British West Indians | 0.0 /100 | #292 | Tragic 97.2% |
| Malaysians | 0.0 /100 | #293 | Tragic 97.2% |
| Immigrants | Grenada | 0.0 /100 | #294 | Tragic 97.2% |
| Immigrants | Immigrants | 0.0 /100 | #295 | Tragic 97.2% |
| Immigrants | Eritrea | 0.0 /100 | #296 | Tragic 97.2% |
| Central American Indians | 0.0 /100 | #297 | Tragic 97.1% |
| Immigrants | Dominica | 0.0 /100 | #298 | Tragic 97.1% |
| Immigrants | Cuba | 0.0 /100 | #299 | Tragic 97.1% |
| Haitians | 0.0 /100 | #300 | Tragic 97.1% |
| Immigrants | South Eastern Asia | 0.0 /100 | #301 | Tragic 97.1% |
| Immigrants | Caribbean | 0.0 /100 | #302 | Tragic 97.0% |
Demographics Similar to Nigerians by 1st Grade
In terms of 1st grade, the demographic groups most similar to Nigerians are U.S. Virgin Islander (97.6%, a difference of 0.0%), Colombian (97.6%, a difference of 0.010%), Immigrants from Malaysia (97.6%, a difference of 0.010%), Immigrants from Western Asia (97.6%, a difference of 0.010%), and Immigrants from Eastern Asia (97.6%, a difference of 0.010%).
| Demographics | Rating | Rank | 1st Grade |
| Puerto Ricans | 3.0 /100 | #231 | Tragic 97.7% |
| Immigrants | Uruguay | 2.5 /100 | #232 | Tragic 97.6% |
| Immigrants | Pakistan | 2.2 /100 | #233 | Tragic 97.6% |
| Colombians | 2.2 /100 | #234 | Tragic 97.6% |
| Immigrants | Malaysia | 2.1 /100 | #235 | Tragic 97.6% |
| Immigrants | Western Asia | 2.1 /100 | #236 | Tragic 97.6% |
| U.S. Virgin Islanders | 1.9 /100 | #237 | Tragic 97.6% |
| Nigerians | 1.8 /100 | #238 | Tragic 97.6% |
| Immigrants | Eastern Asia | 1.6 /100 | #239 | Tragic 97.6% |
| Koreans | 1.5 /100 | #240 | Tragic 97.6% |
| Liberians | 1.4 /100 | #241 | Tragic 97.6% |
| Immigrants | Indonesia | 1.2 /100 | #242 | Tragic 97.6% |
| Bolivians | 1.2 /100 | #243 | Tragic 97.6% |
| Asians | 1.1 /100 | #244 | Tragic 97.6% |
| South Americans | 1.1 /100 | #245 | Tragic 97.6% |