Immigrants from El Salvador vs French American Indian 3rd Grade
COMPARE
Immigrants from El Salvador
French American Indian
3rd Grade
3rd Grade Comparison
Immigrants from El Salvador
French American Indians
95.5%
3RD GRADE
0.0/ 100
METRIC RATING
346th/ 347
METRIC RANK
97.8%
3RD GRADE
60.0/ 100
METRIC RATING
159th/ 347
METRIC RANK
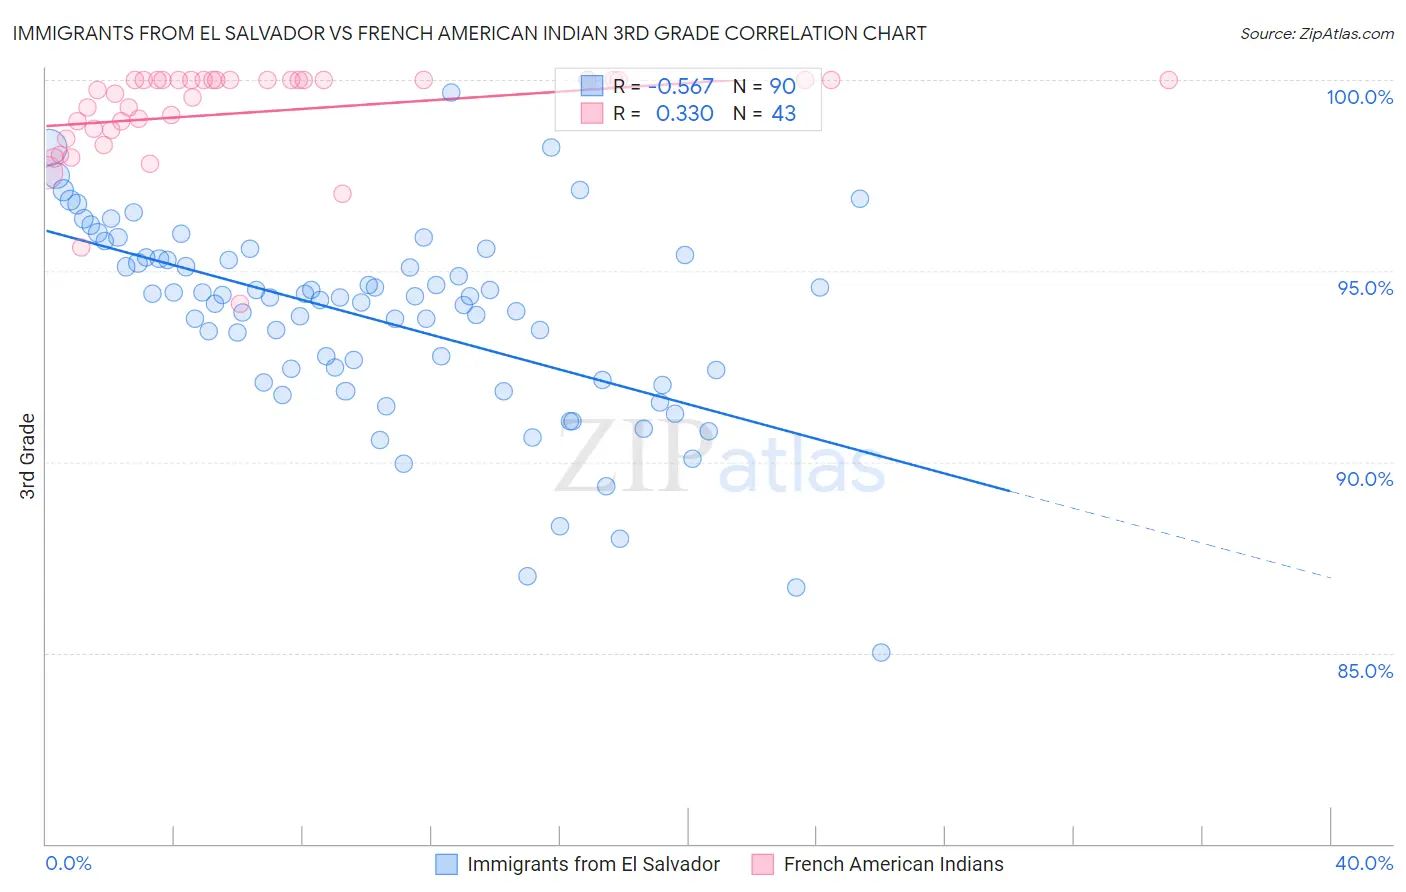
Immigrants from El Salvador vs French American Indian 3rd Grade Correlation Chart
The statistical analysis conducted on geographies consisting of 357,852,938 people shows a substantial negative correlation between the proportion of Immigrants from El Salvador and percentage of population with at least 3rd grade education in the United States with a correlation coefficient (R) of -0.567 and weighted average of 95.5%. Similarly, the statistical analysis conducted on geographies consisting of 131,974,854 people shows a mild positive correlation between the proportion of French American Indians and percentage of population with at least 3rd grade education in the United States with a correlation coefficient (R) of 0.330 and weighted average of 97.8%, a difference of 2.4%.
3rd Grade Correlation Summary
| Measurement | Immigrants from El Salvador | French American Indian |
| Minimum | 85.0% | 94.2% |
| Maximum | 99.7% | 100.0% |
| Range | 14.7% | 5.8% |
| Mean | 93.7% | 99.2% |
| Median | 94.3% | 100.0% |
| Interquartile 25% (IQ1) | 92.1% | 98.7% |
| Interquartile 75% (IQ3) | 95.3% | 100.0% |
| Interquartile Range (IQR) | 3.2% | 1.3% |
| Standard Deviation (Sample) | 2.6% | 1.3% |
| Standard Deviation (Population) | 2.6% | 1.3% |
Similar Demographics by 3rd Grade
Demographics Similar to Immigrants from El Salvador by 3rd Grade
In terms of 3rd grade, the demographic groups most similar to Immigrants from El Salvador are Immigrants from Yemen (95.6%, a difference of 0.060%), Salvadoran (95.7%, a difference of 0.19%), Spanish American Indian (95.3%, a difference of 0.26%), Immigrants from Mexico (95.8%, a difference of 0.30%), and Immigrants from Central America (95.8%, a difference of 0.33%).
| Demographics | Rating | Rank | 3rd Grade |
| Immigrants | Fiji | 0.0 /100 | #333 | Tragic 96.2% |
| Immigrants | Cambodia | 0.0 /100 | #334 | Tragic 96.2% |
| Immigrants | Dominican Republic | 0.0 /100 | #335 | Tragic 96.2% |
| Immigrants | Cabo Verde | 0.0 /100 | #336 | Tragic 96.2% |
| Central Americans | 0.0 /100 | #337 | Tragic 96.1% |
| Guatemalans | 0.0 /100 | #338 | Tragic 96.0% |
| Yakama | 0.0 /100 | #339 | Tragic 95.9% |
| Nepalese | 0.0 /100 | #340 | Tragic 95.9% |
| Immigrants | Central America | 0.0 /100 | #341 | Tragic 95.8% |
| Immigrants | Guatemala | 0.0 /100 | #342 | Tragic 95.8% |
| Immigrants | Mexico | 0.0 /100 | #343 | Tragic 95.8% |
| Salvadorans | 0.0 /100 | #344 | Tragic 95.7% |
| Immigrants | Yemen | 0.0 /100 | #345 | Tragic 95.6% |
| Immigrants | El Salvador | 0.0 /100 | #346 | Tragic 95.5% |
| Spanish American Indians | 0.0 /100 | #347 | Tragic 95.3% |
Demographics Similar to French American Indians by 3rd Grade
In terms of 3rd grade, the demographic groups most similar to French American Indians are Immigrants from Italy (97.8%, a difference of 0.0%), Venezuelan (97.8%, a difference of 0.0%), Immigrants from Iran (97.8%, a difference of 0.0%), Albanian (97.8%, a difference of 0.0%), and Immigrants from Eastern Europe (97.8%, a difference of 0.010%).
| Demographics | Rating | Rank | 3rd Grade |
| Immigrants | South Central Asia | 69.5 /100 | #152 | Good 97.8% |
| Apache | 68.5 /100 | #153 | Good 97.8% |
| Immigrants | Eastern Europe | 64.1 /100 | #154 | Good 97.8% |
| Bermudans | 62.6 /100 | #155 | Good 97.8% |
| Immigrants | Russia | 61.7 /100 | #156 | Good 97.8% |
| Immigrants | Italy | 61.2 /100 | #157 | Good 97.8% |
| Venezuelans | 60.9 /100 | #158 | Good 97.8% |
| French American Indians | 60.0 /100 | #159 | Average 97.8% |
| Immigrants | Iran | 59.1 /100 | #160 | Average 97.8% |
| Albanians | 58.8 /100 | #161 | Average 97.8% |
| Immigrants | Jordan | 57.9 /100 | #162 | Average 97.8% |
| Marshallese | 57.2 /100 | #163 | Average 97.8% |
| Immigrants | Bosnia and Herzegovina | 56.2 /100 | #164 | Average 97.8% |
| Ugandans | 56.1 /100 | #165 | Average 97.8% |
| Dutch West Indians | 55.5 /100 | #166 | Average 97.8% |