Immigrants from Ecuador vs Immigrants from Latin America 3rd Grade
COMPARE
Immigrants from Ecuador
Immigrants from Latin America
3rd Grade
3rd Grade Comparison
Immigrants from Ecuador
Immigrants from Latin America
96.6%
3RD GRADE
0.0/ 100
METRIC RATING
313th/ 347
METRIC RANK
96.2%
3RD GRADE
0.0/ 100
METRIC RATING
331st/ 347
METRIC RANK
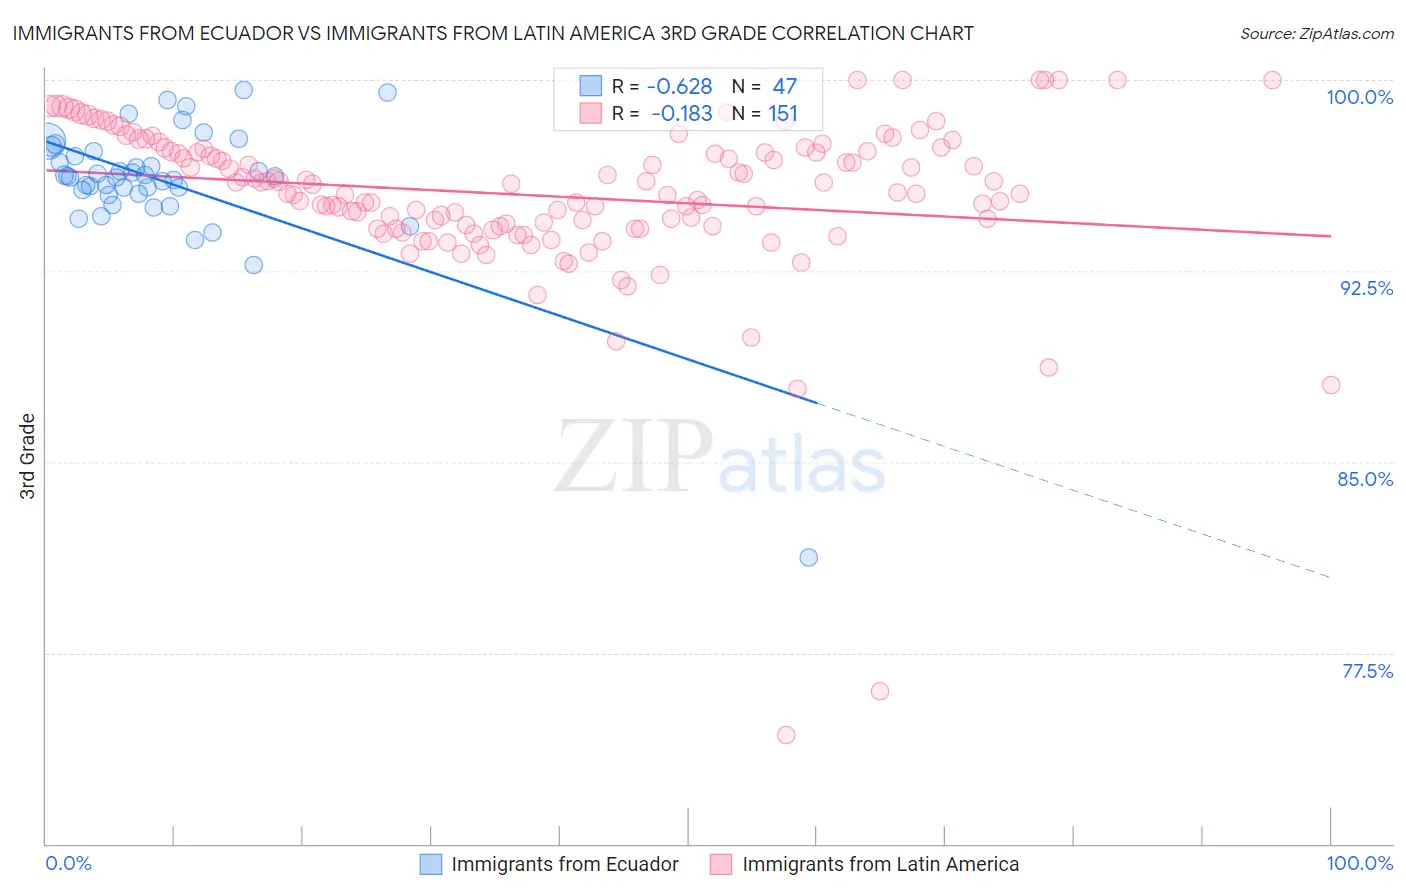
Immigrants from Ecuador vs Immigrants from Latin America 3rd Grade Correlation Chart
The statistical analysis conducted on geographies consisting of 271,020,679 people shows a significant negative correlation between the proportion of Immigrants from Ecuador and percentage of population with at least 3rd grade education in the United States with a correlation coefficient (R) of -0.628 and weighted average of 96.6%. Similarly, the statistical analysis conducted on geographies consisting of 558,652,919 people shows a poor negative correlation between the proportion of Immigrants from Latin America and percentage of population with at least 3rd grade education in the United States with a correlation coefficient (R) of -0.183 and weighted average of 96.2%, a difference of 0.37%.
3rd Grade Correlation Summary
| Measurement | Immigrants from Ecuador | Immigrants from Latin America |
| Minimum | 81.2% | 74.3% |
| Maximum | 99.6% | 100.0% |
| Range | 18.3% | 25.7% |
| Mean | 96.0% | 95.5% |
| Median | 96.2% | 95.6% |
| Interquartile 25% (IQ1) | 95.5% | 94.2% |
| Interquartile 75% (IQ3) | 97.2% | 97.3% |
| Interquartile Range (IQR) | 1.7% | 3.1% |
| Standard Deviation (Sample) | 2.7% | 3.3% |
| Standard Deviation (Population) | 2.6% | 3.3% |
Demographics Similar to Immigrants from Ecuador and Immigrants from Latin America by 3rd Grade
In terms of 3rd grade, the demographic groups most similar to Immigrants from Ecuador are Belizean (96.6%, a difference of 0.0%), Immigrants from Laos (96.6%, a difference of 0.010%), Immigrants from the Azores (96.6%, a difference of 0.010%), Immigrants from Burma/Myanmar (96.6%, a difference of 0.020%), and Immigrants from Bangladesh (96.6%, a difference of 0.040%). Similarly, the demographic groups most similar to Immigrants from Latin America are Immigrants from Armenia (96.3%, a difference of 0.010%), Mexican (96.2%, a difference of 0.010%), Immigrants from Honduras (96.3%, a difference of 0.090%), Bangladeshi (96.3%, a difference of 0.11%), and Immigrants from Vietnam (96.4%, a difference of 0.12%).
| Demographics | Rating | Rank | 3rd Grade |
| Immigrants | Laos | 0.0 /100 | #312 | Tragic 96.6% |
| Immigrants | Ecuador | 0.0 /100 | #313 | Tragic 96.6% |
| Belizeans | 0.0 /100 | #314 | Tragic 96.6% |
| Immigrants | Azores | 0.0 /100 | #315 | Tragic 96.6% |
| Immigrants | Burma/Myanmar | 0.0 /100 | #316 | Tragic 96.6% |
| Immigrants | Bangladesh | 0.0 /100 | #317 | Tragic 96.6% |
| Hispanics or Latinos | 0.0 /100 | #318 | Tragic 96.5% |
| Vietnamese | 0.0 /100 | #319 | Tragic 96.5% |
| Immigrants | Nicaragua | 0.0 /100 | #320 | Tragic 96.5% |
| Indonesians | 0.0 /100 | #321 | Tragic 96.5% |
| Immigrants | Belize | 0.0 /100 | #322 | Tragic 96.5% |
| Hondurans | 0.0 /100 | #323 | Tragic 96.5% |
| Dominicans | 0.0 /100 | #324 | Tragic 96.4% |
| Mexican American Indians | 0.0 /100 | #325 | Tragic 96.4% |
| Immigrants | Vietnam | 0.0 /100 | #326 | Tragic 96.4% |
| Japanese | 0.0 /100 | #327 | Tragic 96.4% |
| Bangladeshis | 0.0 /100 | #328 | Tragic 96.3% |
| Immigrants | Honduras | 0.0 /100 | #329 | Tragic 96.3% |
| Immigrants | Armenia | 0.0 /100 | #330 | Tragic 96.3% |
| Immigrants | Latin America | 0.0 /100 | #331 | Tragic 96.2% |
| Mexicans | 0.0 /100 | #332 | Tragic 96.2% |