Immigrants from Ecuador vs Immigrants from Uruguay Kindergarten
COMPARE
Immigrants from Ecuador
Immigrants from Uruguay
Kindergarten
Kindergarten Comparison
Immigrants from Ecuador
Immigrants from Uruguay
96.9%
KINDERGARTEN
0.0/ 100
METRIC RATING
317th/ 347
METRIC RANK
97.7%
KINDERGARTEN
2.6/ 100
METRIC RATING
232nd/ 347
METRIC RANK
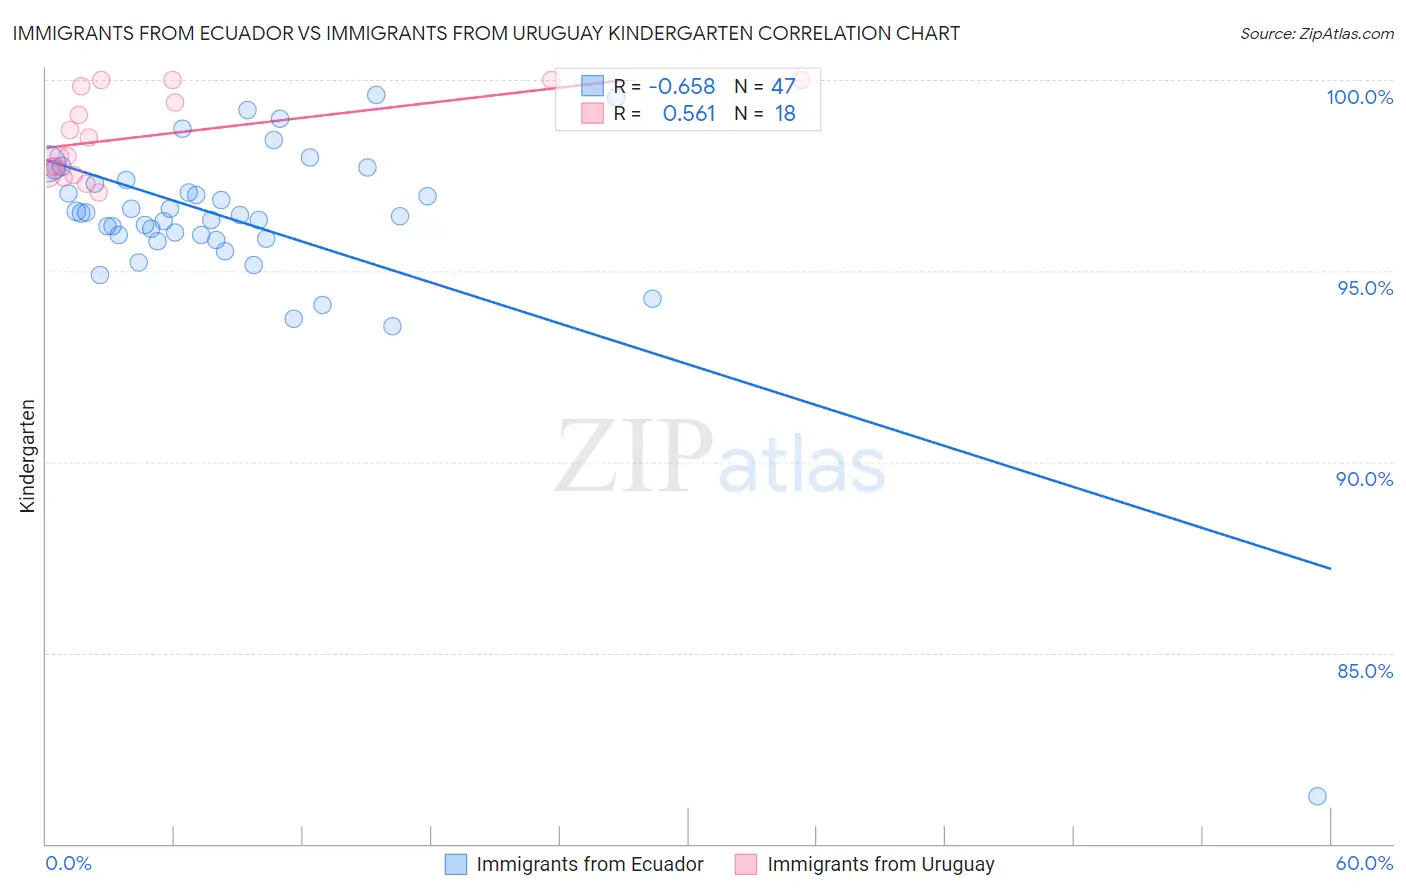
Immigrants from Ecuador vs Immigrants from Uruguay Kindergarten Correlation Chart
The statistical analysis conducted on geographies consisting of 271,020,679 people shows a significant negative correlation between the proportion of Immigrants from Ecuador and percentage of population with at least kindergarten education in the United States with a correlation coefficient (R) of -0.658 and weighted average of 96.9%. Similarly, the statistical analysis conducted on geographies consisting of 133,259,667 people shows a substantial positive correlation between the proportion of Immigrants from Uruguay and percentage of population with at least kindergarten education in the United States with a correlation coefficient (R) of 0.561 and weighted average of 97.7%, a difference of 0.80%.
Kindergarten Correlation Summary
| Measurement | Immigrants from Ecuador | Immigrants from Uruguay |
| Minimum | 81.2% | 97.1% |
| Maximum | 99.6% | 100.0% |
| Range | 18.3% | 2.9% |
| Mean | 96.3% | 98.5% |
| Median | 96.5% | 98.3% |
| Interquartile 25% (IQ1) | 95.8% | 97.5% |
| Interquartile 75% (IQ3) | 97.4% | 99.8% |
| Interquartile Range (IQR) | 1.5% | 2.3% |
| Standard Deviation (Sample) | 2.6% | 1.1% |
| Standard Deviation (Population) | 2.6% | 1.1% |
Similar Demographics by Kindergarten
Demographics Similar to Immigrants from Ecuador by Kindergarten
In terms of kindergarten, the demographic groups most similar to Immigrants from Ecuador are Immigrants from Nicaragua (96.9%, a difference of 0.0%), Immigrants from Belize (96.9%, a difference of 0.010%), Cape Verdean (96.9%, a difference of 0.030%), Honduran (96.9%, a difference of 0.030%), and Guyanese (96.9%, a difference of 0.040%).
| Demographics | Rating | Rank | Kindergarten |
| Immigrants | Azores | 0.0 /100 | #310 | Tragic 97.0% |
| Sri Lankans | 0.0 /100 | #311 | Tragic 97.0% |
| Guyanese | 0.0 /100 | #312 | Tragic 96.9% |
| Cape Verdeans | 0.0 /100 | #313 | Tragic 96.9% |
| Hondurans | 0.0 /100 | #314 | Tragic 96.9% |
| Immigrants | Belize | 0.0 /100 | #315 | Tragic 96.9% |
| Immigrants | Nicaragua | 0.0 /100 | #316 | Tragic 96.9% |
| Immigrants | Ecuador | 0.0 /100 | #317 | Tragic 96.9% |
| Immigrants | Laos | 0.0 /100 | #318 | Tragic 96.9% |
| Immigrants | Guyana | 0.0 /100 | #319 | Tragic 96.8% |
| Immigrants | Burma/Myanmar | 0.0 /100 | #320 | Tragic 96.8% |
| Immigrants | Bangladesh | 0.0 /100 | #321 | Tragic 96.8% |
| Mexican American Indians | 0.0 /100 | #322 | Tragic 96.8% |
| Immigrants | Honduras | 0.0 /100 | #323 | Tragic 96.8% |
| Vietnamese | 0.0 /100 | #324 | Tragic 96.8% |
Demographics Similar to Immigrants from Uruguay by Kindergarten
In terms of kindergarten, the demographic groups most similar to Immigrants from Uruguay are Puerto Rican (97.7%, a difference of 0.010%), Immigrants from Pakistan (97.7%, a difference of 0.010%), Immigrants from Malaysia (97.7%, a difference of 0.010%), Colombian (97.7%, a difference of 0.010%), and Immigrants from Western Asia (97.7%, a difference of 0.010%).
| Demographics | Rating | Rank | Kindergarten |
| Immigrants | Nepal | 3.8 /100 | #225 | Tragic 97.7% |
| Sudanese | 3.7 /100 | #226 | Tragic 97.7% |
| Immigrants | Costa Rica | 3.6 /100 | #227 | Tragic 97.7% |
| Sub-Saharan Africans | 3.5 /100 | #228 | Tragic 97.7% |
| Sierra Leoneans | 3.4 /100 | #229 | Tragic 97.7% |
| Senegalese | 3.3 /100 | #230 | Tragic 97.7% |
| Puerto Ricans | 2.7 /100 | #231 | Tragic 97.7% |
| Immigrants | Uruguay | 2.6 /100 | #232 | Tragic 97.7% |
| Immigrants | Pakistan | 2.2 /100 | #233 | Tragic 97.7% |
| Immigrants | Malaysia | 2.2 /100 | #234 | Tragic 97.7% |
| Colombians | 2.2 /100 | #235 | Tragic 97.7% |
| Immigrants | Western Asia | 2.1 /100 | #236 | Tragic 97.7% |
| Nigerians | 1.8 /100 | #237 | Tragic 97.6% |
| Immigrants | Eastern Asia | 1.7 /100 | #238 | Tragic 97.6% |
| U.S. Virgin Islanders | 1.7 /100 | #239 | Tragic 97.6% |