Immigrants from Ecuador vs Italian 12th Grade, No Diploma
COMPARE
Immigrants from Ecuador
Italian
12th Grade, No Diploma
12th Grade, No Diploma Comparison
Immigrants from Ecuador
Italians
87.5%
12TH GRADE, NO DIPLOMA
0.0/ 100
METRIC RATING
312th/ 347
METRIC RANK
93.2%
12TH GRADE, NO DIPLOMA
99.9/ 100
METRIC RATING
21st/ 347
METRIC RANK
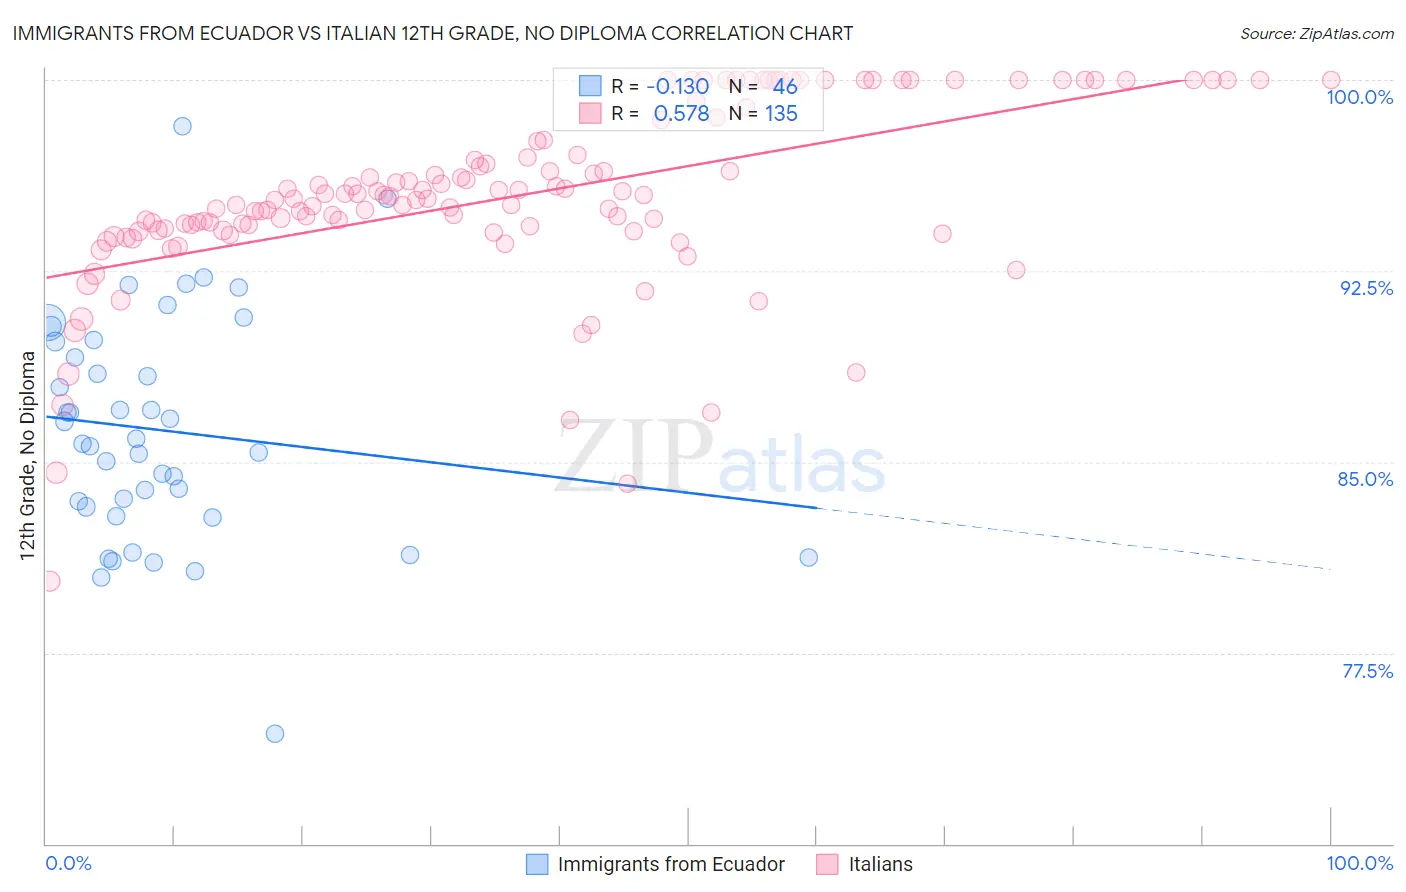
Immigrants from Ecuador vs Italian 12th Grade, No Diploma Correlation Chart
The statistical analysis conducted on geographies consisting of 270,907,929 people shows a poor negative correlation between the proportion of Immigrants from Ecuador and percentage of population with at least 12th grade (no diploma) education in the United States with a correlation coefficient (R) of -0.130 and weighted average of 87.5%. Similarly, the statistical analysis conducted on geographies consisting of 575,116,620 people shows a substantial positive correlation between the proportion of Italians and percentage of population with at least 12th grade (no diploma) education in the United States with a correlation coefficient (R) of 0.578 and weighted average of 93.2%, a difference of 6.5%.
12th Grade, No Diploma Correlation Summary
| Measurement | Immigrants from Ecuador | Italian |
| Minimum | 74.3% | 80.3% |
| Maximum | 98.2% | 100.0% |
| Range | 23.9% | 19.7% |
| Mean | 86.2% | 95.4% |
| Median | 85.8% | 95.3% |
| Interquartile 25% (IQ1) | 83.2% | 94.1% |
| Interquartile 75% (IQ3) | 89.7% | 97.6% |
| Interquartile Range (IQR) | 6.5% | 3.5% |
| Standard Deviation (Sample) | 4.5% | 3.6% |
| Standard Deviation (Population) | 4.4% | 3.5% |
Similar Demographics by 12th Grade, No Diploma
Demographics Similar to Immigrants from Ecuador by 12th Grade, No Diploma
In terms of 12th grade, no diploma, the demographic groups most similar to Immigrants from Ecuador are Yaqui (87.5%, a difference of 0.0%), Immigrants from Cuba (87.5%, a difference of 0.050%), Immigrants from Armenia (87.6%, a difference of 0.10%), Immigrants from Caribbean (87.4%, a difference of 0.12%), and Yup'ik (87.6%, a difference of 0.13%).
| Demographics | Rating | Rank | 12th Grade, No Diploma |
| Immigrants | Dominica | 0.0 /100 | #305 | Tragic 87.7% |
| Natives/Alaskans | 0.0 /100 | #306 | Tragic 87.7% |
| Immigrants | Portugal | 0.0 /100 | #307 | Tragic 87.6% |
| Yup'ik | 0.0 /100 | #308 | Tragic 87.6% |
| Immigrants | Armenia | 0.0 /100 | #309 | Tragic 87.6% |
| Immigrants | Cuba | 0.0 /100 | #310 | Tragic 87.5% |
| Yaqui | 0.0 /100 | #311 | Tragic 87.5% |
| Immigrants | Ecuador | 0.0 /100 | #312 | Tragic 87.5% |
| Immigrants | Caribbean | 0.0 /100 | #313 | Tragic 87.4% |
| Cape Verdeans | 0.0 /100 | #314 | Tragic 87.4% |
| Nicaraguans | 0.0 /100 | #315 | Tragic 87.3% |
| Apache | 0.0 /100 | #316 | Tragic 87.3% |
| Navajo | 0.0 /100 | #317 | Tragic 87.1% |
| Belizeans | 0.0 /100 | #318 | Tragic 87.0% |
| Immigrants | Belize | 0.0 /100 | #319 | Tragic 87.0% |
Demographics Similar to Italians by 12th Grade, No Diploma
In terms of 12th grade, no diploma, the demographic groups most similar to Italians are Estonian (93.2%, a difference of 0.010%), Filipino (93.2%, a difference of 0.020%), Scandinavian (93.2%, a difference of 0.020%), Thai (93.2%, a difference of 0.030%), and German (93.3%, a difference of 0.050%).
| Demographics | Rating | Rank | 12th Grade, No Diploma |
| Bulgarians | 100.0 /100 | #14 | Exceptional 93.5% |
| Finns | 100.0 /100 | #15 | Exceptional 93.4% |
| Maltese | 100.0 /100 | #16 | Exceptional 93.3% |
| Luxembourgers | 100.0 /100 | #17 | Exceptional 93.3% |
| Immigrants | Singapore | 99.9 /100 | #18 | Exceptional 93.3% |
| Germans | 99.9 /100 | #19 | Exceptional 93.3% |
| Filipinos | 99.9 /100 | #20 | Exceptional 93.2% |
| Italians | 99.9 /100 | #21 | Exceptional 93.2% |
| Estonians | 99.9 /100 | #22 | Exceptional 93.2% |
| Scandinavians | 99.9 /100 | #23 | Exceptional 93.2% |
| Thais | 99.9 /100 | #24 | Exceptional 93.2% |
| Czechs | 99.9 /100 | #25 | Exceptional 93.2% |
| Russians | 99.9 /100 | #26 | Exceptional 93.2% |
| Cypriots | 99.9 /100 | #27 | Exceptional 93.1% |
| Immigrants | Northern Europe | 99.9 /100 | #28 | Exceptional 93.1% |