Immigrants from Eastern Europe vs Immigrants from Guyana Master's Degree
COMPARE
Immigrants from Eastern Europe
Immigrants from Guyana
Master's Degree
Master's Degree Comparison
Immigrants from Eastern Europe
Immigrants from Guyana
17.6%
MASTER'S DEGREE
99.6/ 100
METRIC RATING
77th/ 347
METRIC RANK
13.4%
MASTER'S DEGREE
4.4/ 100
METRIC RATING
236th/ 347
METRIC RANK
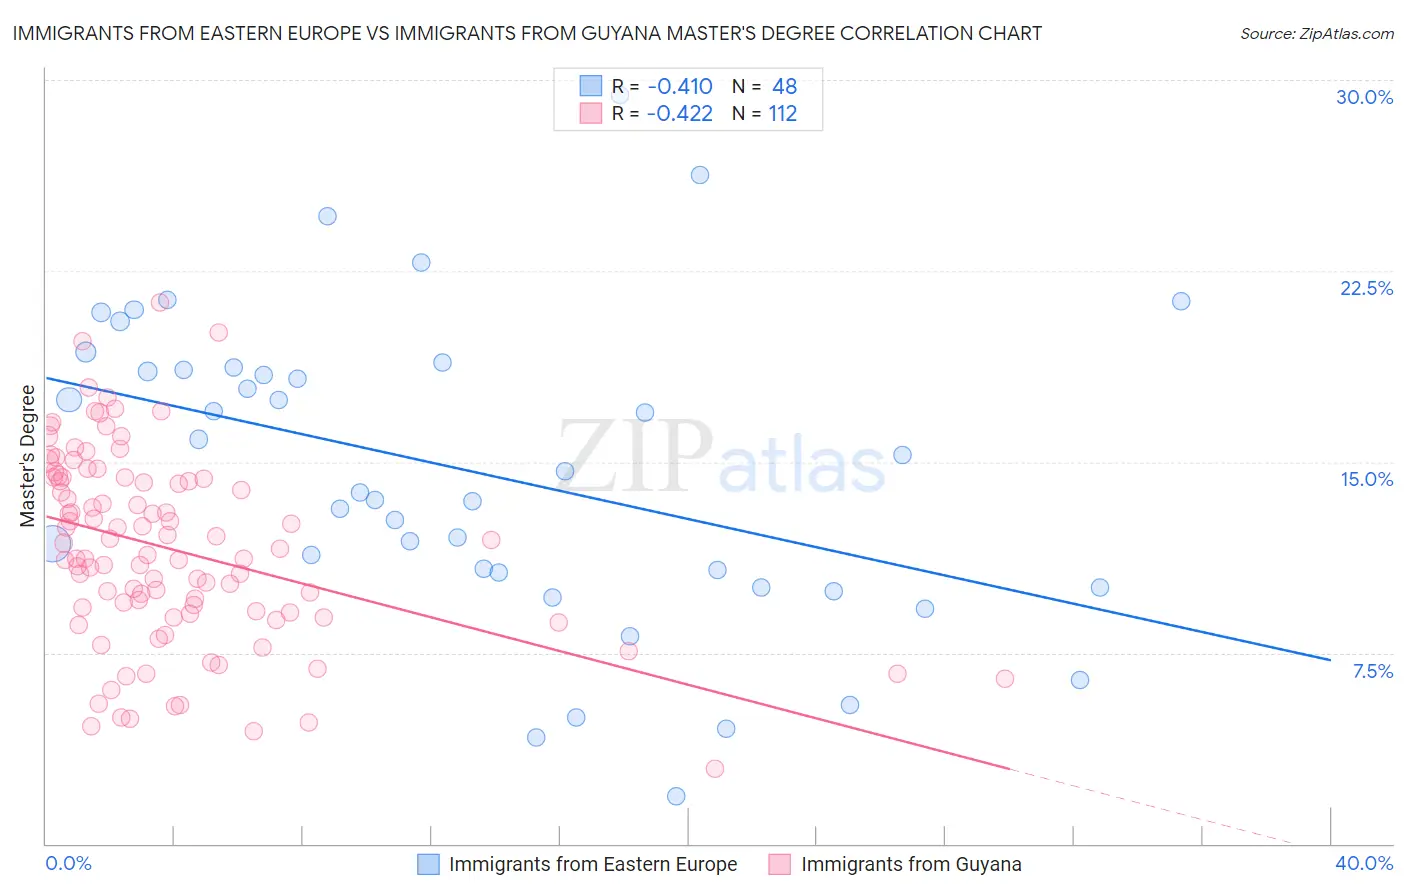
Immigrants from Eastern Europe vs Immigrants from Guyana Master's Degree Correlation Chart
The statistical analysis conducted on geographies consisting of 475,675,082 people shows a moderate negative correlation between the proportion of Immigrants from Eastern Europe and percentage of population with at least master's degree education in the United States with a correlation coefficient (R) of -0.410 and weighted average of 17.6%. Similarly, the statistical analysis conducted on geographies consisting of 183,731,921 people shows a moderate negative correlation between the proportion of Immigrants from Guyana and percentage of population with at least master's degree education in the United States with a correlation coefficient (R) of -0.422 and weighted average of 13.4%, a difference of 30.7%.
Master's Degree Correlation Summary
| Measurement | Immigrants from Eastern Europe | Immigrants from Guyana |
| Minimum | 1.9% | 3.0% |
| Maximum | 29.4% | 21.2% |
| Range | 27.5% | 18.3% |
| Mean | 14.6% | 11.6% |
| Median | 14.2% | 11.5% |
| Interquartile 25% (IQ1) | 10.3% | 9.1% |
| Interquartile 75% (IQ3) | 18.7% | 14.3% |
| Interquartile Range (IQR) | 8.3% | 5.3% |
| Standard Deviation (Sample) | 6.1% | 3.7% |
| Standard Deviation (Population) | 6.0% | 3.7% |
Similar Demographics by Master's Degree
Demographics Similar to Immigrants from Eastern Europe by Master's Degree
In terms of master's degree, the demographic groups most similar to Immigrants from Eastern Europe are Immigrants from Indonesia (17.6%, a difference of 0.12%), Egyptian (17.6%, a difference of 0.14%), Immigrants from Hungary (17.5%, a difference of 0.19%), Immigrants from Lebanon (17.5%, a difference of 0.33%), and Carpatho Rusyn (17.5%, a difference of 0.38%).
| Demographics | Rating | Rank | Master's Degree |
| Immigrants | Western Europe | 99.8 /100 | #70 | Exceptional 17.8% |
| Immigrants | Pakistan | 99.7 /100 | #71 | Exceptional 17.8% |
| Lithuanians | 99.7 /100 | #72 | Exceptional 17.7% |
| Zimbabweans | 99.7 /100 | #73 | Exceptional 17.7% |
| Immigrants | Romania | 99.7 /100 | #74 | Exceptional 17.7% |
| Egyptians | 99.6 /100 | #75 | Exceptional 17.6% |
| Immigrants | Indonesia | 99.6 /100 | #76 | Exceptional 17.6% |
| Immigrants | Eastern Europe | 99.6 /100 | #77 | Exceptional 17.6% |
| Immigrants | Hungary | 99.6 /100 | #78 | Exceptional 17.5% |
| Immigrants | Lebanon | 99.6 /100 | #79 | Exceptional 17.5% |
| Carpatho Rusyns | 99.6 /100 | #80 | Exceptional 17.5% |
| Immigrants | Western Asia | 99.5 /100 | #81 | Exceptional 17.5% |
| Greeks | 99.5 /100 | #82 | Exceptional 17.5% |
| Immigrants | Zimbabwe | 99.5 /100 | #83 | Exceptional 17.4% |
| Immigrants | Scotland | 99.4 /100 | #84 | Exceptional 17.4% |
Demographics Similar to Immigrants from Guyana by Master's Degree
In terms of master's degree, the demographic groups most similar to Immigrants from Guyana are German Russian (13.5%, a difference of 0.11%), Jamaican (13.4%, a difference of 0.22%), Hmong (13.4%, a difference of 0.36%), Immigrants from Burma/Myanmar (13.5%, a difference of 0.52%), and Nonimmigrants (13.3%, a difference of 0.89%).
| Demographics | Rating | Rank | Master's Degree |
| British West Indians | 8.8 /100 | #229 | Tragic 13.8% |
| Dutch | 8.7 /100 | #230 | Tragic 13.8% |
| Guyanese | 7.6 /100 | #231 | Tragic 13.7% |
| Immigrants | Philippines | 6.0 /100 | #232 | Tragic 13.6% |
| Immigrants | Ecuador | 5.7 /100 | #233 | Tragic 13.6% |
| Immigrants | Burma/Myanmar | 5.0 /100 | #234 | Tragic 13.5% |
| German Russians | 4.5 /100 | #235 | Tragic 13.5% |
| Immigrants | Guyana | 4.4 /100 | #236 | Tragic 13.4% |
| Jamaicans | 4.1 /100 | #237 | Tragic 13.4% |
| Hmong | 4.0 /100 | #238 | Tragic 13.4% |
| Immigrants | Nonimmigrants | 3.4 /100 | #239 | Tragic 13.3% |
| Guamanians/Chamorros | 2.2 /100 | #240 | Tragic 13.1% |
| U.S. Virgin Islanders | 2.1 /100 | #241 | Tragic 13.1% |
| Spanish Americans | 1.9 /100 | #242 | Tragic 13.0% |
| Immigrants | Jamaica | 1.9 /100 | #243 | Tragic 13.0% |