Immigrants from Eastern Europe vs Immigrants from Guyana Family Households with Children
COMPARE
Immigrants from Eastern Europe
Immigrants from Guyana
Family Households with Children
Family Households with Children Comparison
Immigrants from Eastern Europe
Immigrants from Guyana
26.9%
FAMILY HOUSEHOLDS WITH CHILDREN
2.1/ 100
METRIC RATING
249th/ 347
METRIC RANK
26.3%
FAMILY HOUSEHOLDS WITH CHILDREN
0.1/ 100
METRIC RATING
303rd/ 347
METRIC RANK
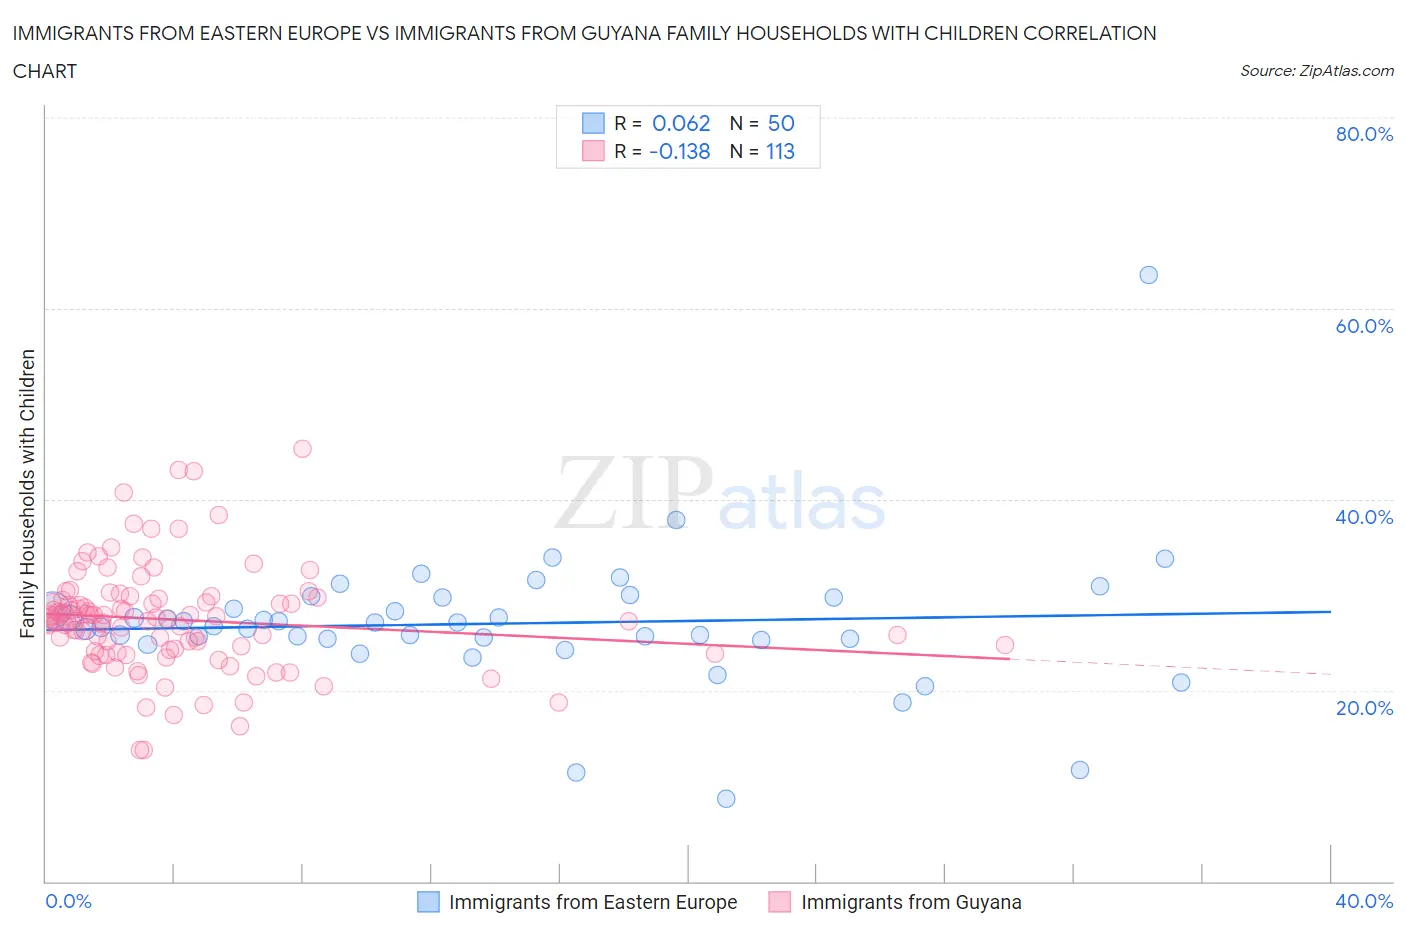
Immigrants from Eastern Europe vs Immigrants from Guyana Family Households with Children Correlation Chart
The statistical analysis conducted on geographies consisting of 475,239,600 people shows a slight positive correlation between the proportion of Immigrants from Eastern Europe and percentage of family households with children in the United States with a correlation coefficient (R) of 0.062 and weighted average of 26.9%. Similarly, the statistical analysis conducted on geographies consisting of 183,626,944 people shows a poor negative correlation between the proportion of Immigrants from Guyana and percentage of family households with children in the United States with a correlation coefficient (R) of -0.138 and weighted average of 26.3%, a difference of 2.0%.
Family Households with Children Correlation Summary
| Measurement | Immigrants from Eastern Europe | Immigrants from Guyana |
| Minimum | 8.7% | 13.8% |
| Maximum | 63.5% | 45.3% |
| Range | 54.8% | 31.5% |
| Mean | 27.0% | 27.4% |
| Median | 26.9% | 27.3% |
| Interquartile 25% (IQ1) | 25.4% | 24.2% |
| Interquartile 75% (IQ3) | 29.8% | 29.6% |
| Interquartile Range (IQR) | 4.4% | 5.4% |
| Standard Deviation (Sample) | 7.5% | 5.5% |
| Standard Deviation (Population) | 7.4% | 5.5% |
Similar Demographics by Family Households with Children
Demographics Similar to Immigrants from Eastern Europe by Family Households with Children
In terms of family households with children, the demographic groups most similar to Immigrants from Eastern Europe are Belgian (26.9%, a difference of 0.010%), Immigrants from Kazakhstan (26.9%, a difference of 0.020%), Potawatomi (26.9%, a difference of 0.030%), Immigrants from Bosnia and Herzegovina (26.8%, a difference of 0.070%), and Jamaican (26.9%, a difference of 0.090%).
| Demographics | Rating | Rank | Family Households with Children |
| Immigrants | England | 3.2 /100 | #242 | Tragic 26.9% |
| Immigrants | Saudi Arabia | 2.9 /100 | #243 | Tragic 26.9% |
| Ukrainians | 2.9 /100 | #244 | Tragic 26.9% |
| Australians | 2.8 /100 | #245 | Tragic 26.9% |
| Jamaicans | 2.5 /100 | #246 | Tragic 26.9% |
| Potawatomi | 2.2 /100 | #247 | Tragic 26.9% |
| Immigrants | Kazakhstan | 2.2 /100 | #248 | Tragic 26.9% |
| Immigrants | Eastern Europe | 2.1 /100 | #249 | Tragic 26.9% |
| Belgians | 2.1 /100 | #250 | Tragic 26.9% |
| Immigrants | Bosnia and Herzegovina | 1.9 /100 | #251 | Tragic 26.8% |
| Irish | 1.8 /100 | #252 | Tragic 26.8% |
| Italians | 1.5 /100 | #253 | Tragic 26.8% |
| Immigrants | Scotland | 1.5 /100 | #254 | Tragic 26.8% |
| German Russians | 1.5 /100 | #255 | Tragic 26.8% |
| Scotch-Irish | 1.4 /100 | #256 | Tragic 26.8% |
Demographics Similar to Immigrants from Guyana by Family Households with Children
In terms of family households with children, the demographic groups most similar to Immigrants from Guyana are Serbian (26.4%, a difference of 0.030%), Immigrants from Trinidad and Tobago (26.4%, a difference of 0.040%), Immigrants from Bahamas (26.3%, a difference of 0.050%), Paiute (26.4%, a difference of 0.060%), and Guyanese (26.3%, a difference of 0.080%).
| Demographics | Rating | Rank | Family Households with Children |
| Croatians | 0.1 /100 | #296 | Tragic 26.4% |
| Armenians | 0.1 /100 | #297 | Tragic 26.4% |
| Immigrants | Western Europe | 0.1 /100 | #298 | Tragic 26.4% |
| Trinidadians and Tobagonians | 0.1 /100 | #299 | Tragic 26.4% |
| Paiute | 0.1 /100 | #300 | Tragic 26.4% |
| Immigrants | Trinidad and Tobago | 0.1 /100 | #301 | Tragic 26.4% |
| Serbians | 0.1 /100 | #302 | Tragic 26.4% |
| Immigrants | Guyana | 0.1 /100 | #303 | Tragic 26.3% |
| Immigrants | Bahamas | 0.1 /100 | #304 | Tragic 26.3% |
| Guyanese | 0.1 /100 | #305 | Tragic 26.3% |
| Bermudans | 0.1 /100 | #306 | Tragic 26.3% |
| West Indians | 0.0 /100 | #307 | Tragic 26.3% |
| Lumbee | 0.0 /100 | #308 | Tragic 26.3% |
| Immigrants | Somalia | 0.0 /100 | #309 | Tragic 26.3% |
| Marshallese | 0.0 /100 | #310 | Tragic 26.2% |