Immigrants from Eastern Europe vs Sioux Master's Degree
COMPARE
Immigrants from Eastern Europe
Sioux
Master's Degree
Master's Degree Comparison
Immigrants from Eastern Europe
Sioux
17.6%
MASTER'S DEGREE
99.6/ 100
METRIC RATING
77th/ 347
METRIC RANK
10.7%
MASTER'S DEGREE
0.0/ 100
METRIC RATING
322nd/ 347
METRIC RANK
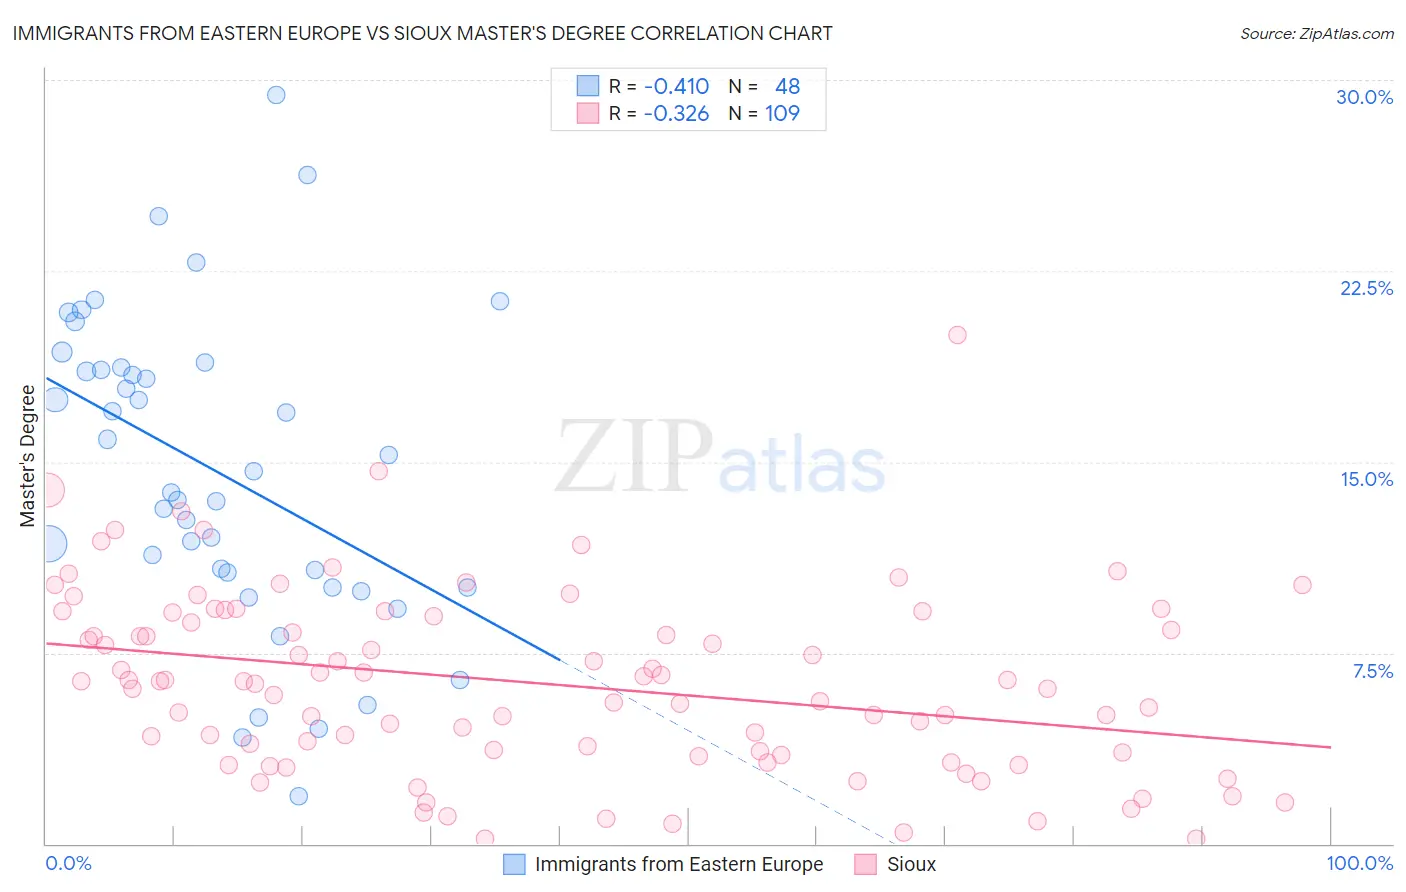
Immigrants from Eastern Europe vs Sioux Master's Degree Correlation Chart
The statistical analysis conducted on geographies consisting of 475,675,082 people shows a moderate negative correlation between the proportion of Immigrants from Eastern Europe and percentage of population with at least master's degree education in the United States with a correlation coefficient (R) of -0.410 and weighted average of 17.6%. Similarly, the statistical analysis conducted on geographies consisting of 234,105,969 people shows a mild negative correlation between the proportion of Sioux and percentage of population with at least master's degree education in the United States with a correlation coefficient (R) of -0.326 and weighted average of 10.7%, a difference of 64.7%.
Master's Degree Correlation Summary
| Measurement | Immigrants from Eastern Europe | Sioux |
| Minimum | 1.9% | 0.18% |
| Maximum | 29.4% | 20.0% |
| Range | 27.5% | 19.8% |
| Mean | 14.6% | 6.3% |
| Median | 14.2% | 6.4% |
| Interquartile 25% (IQ1) | 10.3% | 3.5% |
| Interquartile 75% (IQ3) | 18.7% | 9.0% |
| Interquartile Range (IQR) | 8.3% | 5.5% |
| Standard Deviation (Sample) | 6.1% | 3.6% |
| Standard Deviation (Population) | 6.0% | 3.6% |
Similar Demographics by Master's Degree
Demographics Similar to Immigrants from Eastern Europe by Master's Degree
In terms of master's degree, the demographic groups most similar to Immigrants from Eastern Europe are Immigrants from Indonesia (17.6%, a difference of 0.12%), Egyptian (17.6%, a difference of 0.14%), Immigrants from Hungary (17.5%, a difference of 0.19%), Immigrants from Lebanon (17.5%, a difference of 0.33%), and Carpatho Rusyn (17.5%, a difference of 0.38%).
| Demographics | Rating | Rank | Master's Degree |
| Immigrants | Western Europe | 99.8 /100 | #70 | Exceptional 17.8% |
| Immigrants | Pakistan | 99.7 /100 | #71 | Exceptional 17.8% |
| Lithuanians | 99.7 /100 | #72 | Exceptional 17.7% |
| Zimbabweans | 99.7 /100 | #73 | Exceptional 17.7% |
| Immigrants | Romania | 99.7 /100 | #74 | Exceptional 17.7% |
| Egyptians | 99.6 /100 | #75 | Exceptional 17.6% |
| Immigrants | Indonesia | 99.6 /100 | #76 | Exceptional 17.6% |
| Immigrants | Eastern Europe | 99.6 /100 | #77 | Exceptional 17.6% |
| Immigrants | Hungary | 99.6 /100 | #78 | Exceptional 17.5% |
| Immigrants | Lebanon | 99.6 /100 | #79 | Exceptional 17.5% |
| Carpatho Rusyns | 99.6 /100 | #80 | Exceptional 17.5% |
| Immigrants | Western Asia | 99.5 /100 | #81 | Exceptional 17.5% |
| Greeks | 99.5 /100 | #82 | Exceptional 17.5% |
| Immigrants | Zimbabwe | 99.5 /100 | #83 | Exceptional 17.4% |
| Immigrants | Scotland | 99.4 /100 | #84 | Exceptional 17.4% |
Demographics Similar to Sioux by Master's Degree
In terms of master's degree, the demographic groups most similar to Sioux are Crow (10.6%, a difference of 0.39%), Dutch West Indian (10.6%, a difference of 0.44%), Pennsylvania German (10.7%, a difference of 0.64%), Immigrants from Micronesia (10.8%, a difference of 0.85%), and Kiowa (10.8%, a difference of 1.5%).
| Demographics | Rating | Rank | Master's Degree |
| Apache | 0.0 /100 | #315 | Tragic 11.0% |
| Hispanics or Latinos | 0.0 /100 | #316 | Tragic 10.9% |
| Hopi | 0.0 /100 | #317 | Tragic 10.9% |
| Immigrants | Cuba | 0.0 /100 | #318 | Tragic 10.9% |
| Kiowa | 0.0 /100 | #319 | Tragic 10.8% |
| Immigrants | Micronesia | 0.0 /100 | #320 | Tragic 10.8% |
| Pennsylvania Germans | 0.0 /100 | #321 | Tragic 10.7% |
| Sioux | 0.0 /100 | #322 | Tragic 10.7% |
| Crow | 0.0 /100 | #323 | Tragic 10.6% |
| Dutch West Indians | 0.0 /100 | #324 | Tragic 10.6% |
| Inupiat | 0.0 /100 | #325 | Tragic 10.5% |
| Creek | 0.0 /100 | #326 | Tragic 10.5% |
| Paiute | 0.0 /100 | #327 | Tragic 10.5% |
| Bangladeshis | 0.0 /100 | #328 | Tragic 10.5% |
| Nepalese | 0.0 /100 | #329 | Tragic 10.5% |