Immigrants from Eastern Asia vs Hawaiian 7th Grade
COMPARE
Immigrants from Eastern Asia
Hawaiian
7th Grade
7th Grade Comparison
Immigrants from Eastern Asia
Hawaiians
95.6%
7TH GRADE
5.8/ 100
METRIC RATING
226th/ 347
METRIC RANK
95.8%
7TH GRADE
16.0/ 100
METRIC RATING
210th/ 347
METRIC RANK
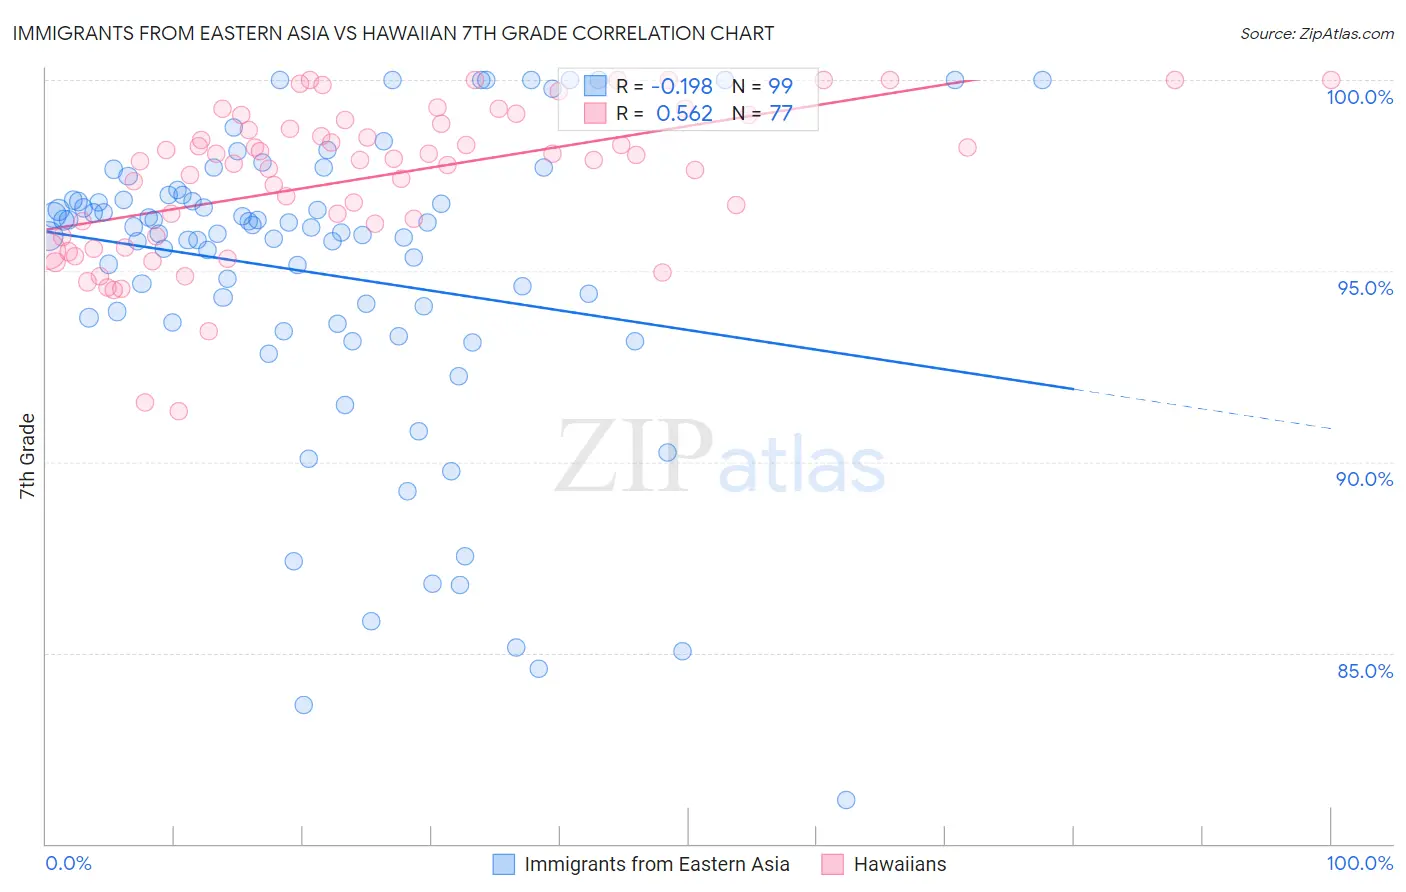
Immigrants from Eastern Asia vs Hawaiian 7th Grade Correlation Chart
The statistical analysis conducted on geographies consisting of 499,846,352 people shows a poor negative correlation between the proportion of Immigrants from Eastern Asia and percentage of population with at least 7th grade education in the United States with a correlation coefficient (R) of -0.198 and weighted average of 95.6%. Similarly, the statistical analysis conducted on geographies consisting of 327,621,279 people shows a substantial positive correlation between the proportion of Hawaiians and percentage of population with at least 7th grade education in the United States with a correlation coefficient (R) of 0.562 and weighted average of 95.8%, a difference of 0.17%.
7th Grade Correlation Summary
| Measurement | Immigrants from Eastern Asia | Hawaiian |
| Minimum | 81.1% | 91.3% |
| Maximum | 100.0% | 100.0% |
| Range | 18.9% | 8.7% |
| Mean | 94.9% | 97.4% |
| Median | 96.0% | 97.9% |
| Interquartile 25% (IQ1) | 93.7% | 95.9% |
| Interquartile 75% (IQ3) | 96.9% | 98.9% |
| Interquartile Range (IQR) | 3.2% | 3.0% |
| Standard Deviation (Sample) | 4.0% | 2.0% |
| Standard Deviation (Population) | 4.0% | 2.0% |
Demographics Similar to Immigrants from Eastern Asia and Hawaiians by 7th Grade
In terms of 7th grade, the demographic groups most similar to Immigrants from Eastern Asia are Immigrants from Malaysia (95.6%, a difference of 0.010%), Immigrants from Western Asia (95.6%, a difference of 0.010%), Immigrants from Syria (95.7%, a difference of 0.020%), Immigrants from Oceania (95.7%, a difference of 0.020%), and Immigrants from Eastern Africa (95.6%, a difference of 0.020%). Similarly, the demographic groups most similar to Hawaiians are Dutch West Indian (95.8%, a difference of 0.0%), Immigrants from Sudan (95.8%, a difference of 0.010%), Portuguese (95.8%, a difference of 0.030%), Immigrants from Lebanon (95.8%, a difference of 0.040%), and Immigrants from Morocco (95.8%, a difference of 0.040%).
| Demographics | Rating | Rank | 7th Grade |
| Immigrants | Sudan | 17.0 /100 | #208 | Poor 95.8% |
| Dutch West Indians | 16.1 /100 | #209 | Poor 95.8% |
| Hawaiians | 16.0 /100 | #210 | Poor 95.8% |
| Portuguese | 13.6 /100 | #211 | Poor 95.8% |
| Immigrants | Lebanon | 13.0 /100 | #212 | Poor 95.8% |
| Immigrants | Morocco | 12.6 /100 | #213 | Poor 95.8% |
| Bahamians | 11.6 /100 | #214 | Poor 95.7% |
| Spanish Americans | 9.3 /100 | #215 | Tragic 95.7% |
| Immigrants | Chile | 9.1 /100 | #216 | Tragic 95.7% |
| Immigrants | Pakistan | 9.0 /100 | #217 | Tragic 95.7% |
| Immigrants | Liberia | 8.1 /100 | #218 | Tragic 95.7% |
| Immigrants | Southern Europe | 7.9 /100 | #219 | Tragic 95.7% |
| Sub-Saharan Africans | 7.2 /100 | #220 | Tragic 95.7% |
| Samoans | 7.0 /100 | #221 | Tragic 95.7% |
| Laotians | 6.8 /100 | #222 | Tragic 95.7% |
| Immigrants | Syria | 6.7 /100 | #223 | Tragic 95.7% |
| Immigrants | Oceania | 6.7 /100 | #224 | Tragic 95.7% |
| Immigrants | Malaysia | 6.2 /100 | #225 | Tragic 95.6% |
| Immigrants | Eastern Asia | 5.8 /100 | #226 | Tragic 95.6% |
| Immigrants | Western Asia | 5.4 /100 | #227 | Tragic 95.6% |
| Immigrants | Eastern Africa | 5.1 /100 | #228 | Tragic 95.6% |